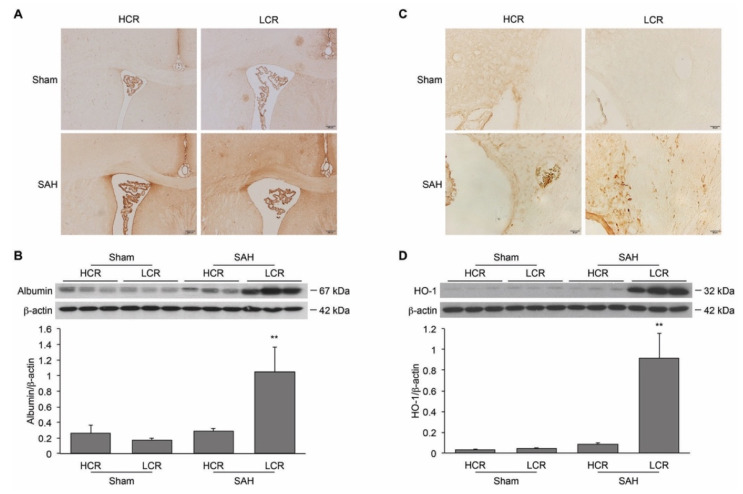
Figure 3.
SAH induced greater BBB breakdown and more HO-1 upregulation 24 h after SAH in LCR rats than in HCR rats. (A) Representative images of periventricular albumin immunohistochemistry in LCR and HCR rats after SAH or a sham operation. Albumin-positive staining is indicated by the darker color in brown intensity. Scale bar = 200 μm. (B) Albumin levels were quantified by Western blotting. Values are mean ± SD; ** p < 0.01 LCR + SAH versus HCR + SAH. (C) Representative images of periventricular HO-1 immunohistochemistry in LCR and HCR rats after SAH or a sham operation. Scale bar = 20 μm. (D) HO-1 levels were quantified by Western blotting. Values are mean ± SD; ** p < 0.01 LCR + SAH versus HCR + SAH.

