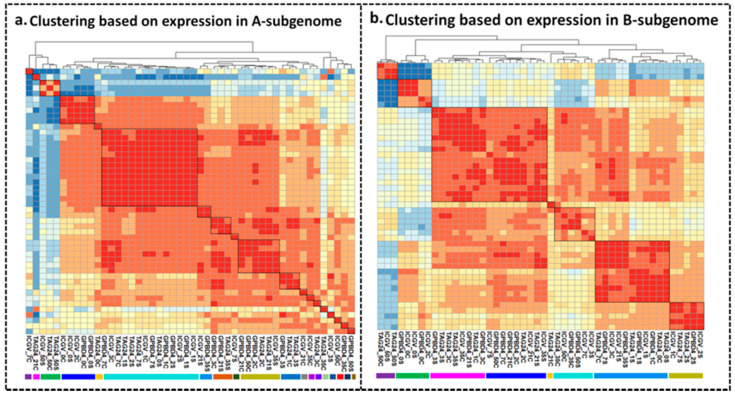
Figure 1.
Pairwise correlation between stressed and control tissues using global gene expression patterns in A- and B-subgenomes. Genes with a normalized expression level FPKM > 1 in at least one of the 48 tissues analyzed were log2. +1 transformed before analysis and were designated as expressed. (a) Clustering based on expression in A-subgenome. (b) Clustering based on expression in B-subgenome.

