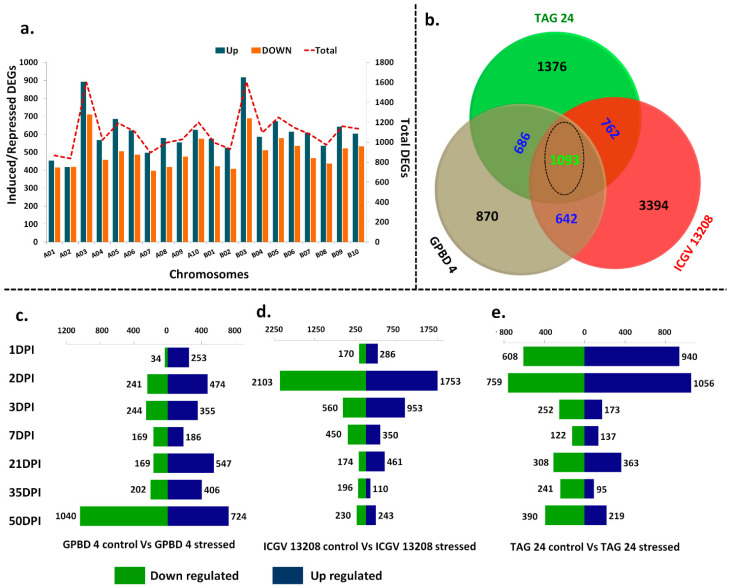
Figure 2.
Summary of globally differentially expressed genes and DEGs between control and stressed samples of same genotypes at different stages. (a) Genome wide differentially expressed genes including upregulated (blue) and downregulated (orange) plotted on primary axis. The upper dotted line indicates total DEGs (up- and downregulated) plotted on secondary axis. (b) Venn diagram representing the globally expressed common, unique and core set of DEGs between GPBD 4, TAG 24 and ICGV 13208. The day wise up- and downregulated DEGs are presented in (c) GPBD 4 control vs. GPBD 4 stressed, (d) ICGV 13208 control vs. ICGV 13208 stressed, (e) TAG 24 control vs. TAG 24 stressed.

