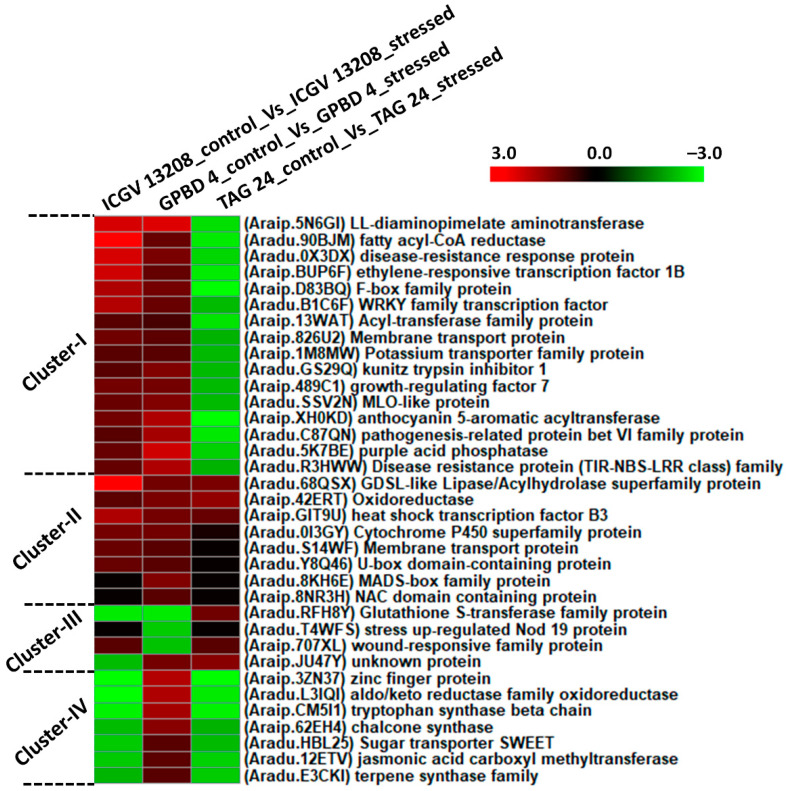
Figure 4.
Expression profiles of differentially expressed genes stressed condition between control and stressed samples of each genotype. The clustering of genes was performed using the log2 fold change for each DEG under three combinations (ICGV 13208 control vs. ICGV 13208 stressed, GPBD 4 control vs. GPBD 4 stressed, and TAG 24 control vs. TAG 24 stressed).

