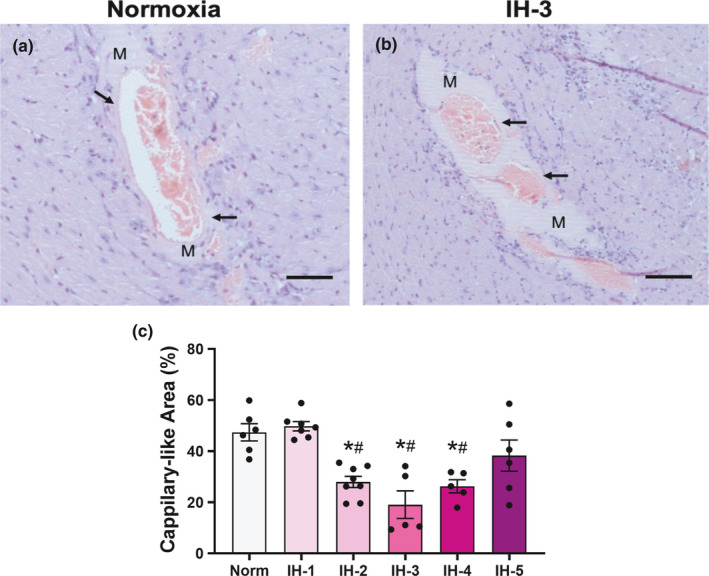
FIGURE 2.

In vivo myocardial angiogenesis. Representative hematoxylin/eosin staining sections of the left ventricle from a normoxia and IH‐3 (a and b). Representative images were obtained using a 20x objective. Arrows indicate the occurrence of cardiac angiogenesis around the Matrigel plug. M indicates the Matrigel plug in the left ventricular myocardium. (c) Quantitative analysis of angiogenesis, *Different from normoxia (p < 0.001), #different from IH‐1 (p < 0.001), N = 6–8/group. Results are expressed as the percentage of vessel area in the total Matrigel area, mean ± SEM. Scale bar: 100 μM
