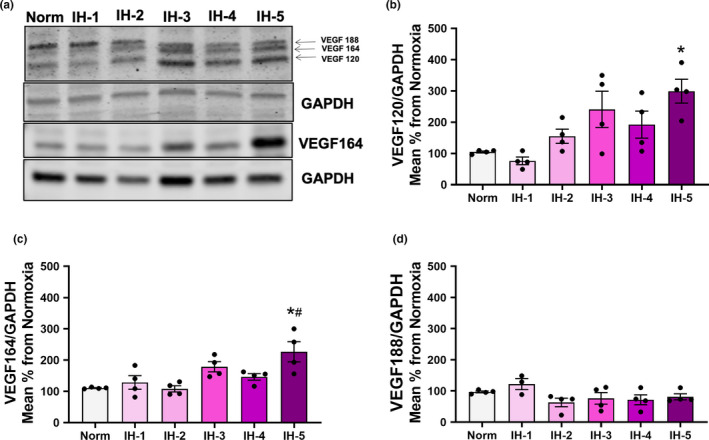
FIGURE 6.

Protein expression of VEGF isoforms in left ventricular myocardium by duration of intermittent hypoxia. (a) Representative images of cardiac VEGF188, VEGF164, and VEGF120 in the left ventricle quantified by Western blot with normalization against GAPDH (N = 4/group). (b) Densitometry analysis of VEGF120. *different from normoxia (p = 0.01) and IH‐1 (p = 0.03). (c) Densitometry analysis of VEGF164. *different from normoxia (p < 0.001) and IH‐1 (p = 0.01). (d) Densitometry analysis of VEGF188, no significant changes found. Results are expressed as mean ± SEM in arbitrary units
