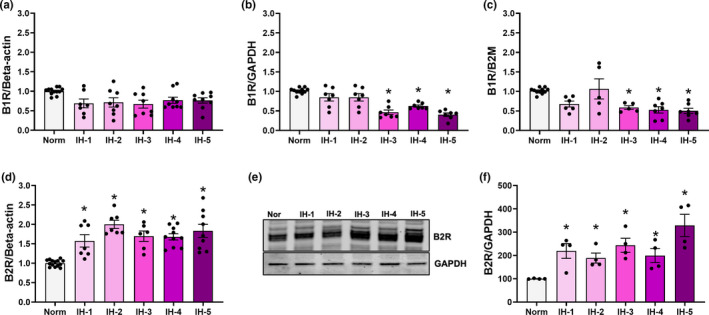
FIGURE 7.

B1R mRNA levels and B2R expression in the left ventricular myocardium by duration of intermittent hypoxia. Plot of B1R mRNA levels relative to β‐actin (a) GAPDH (b) and B2 M (c) as endogenous controls (N=8‐12/group). (b) *Different from normoxia (p < 0.001). (c) *Different from normoxia (p < 0.02). (d) Plot of B2R mRNA expression as determined by RT‐PCR (N = 8–12/group). *different from normoxia (p < 0.001). (e) Representative western blot of B2R protein expression in the left ventricle (N = 4/group). (f) Densitometry analysis of B2R, normalized against GAPDH. *different from normoxia (p = 0.03). Results are expressed as mean ± SEM
