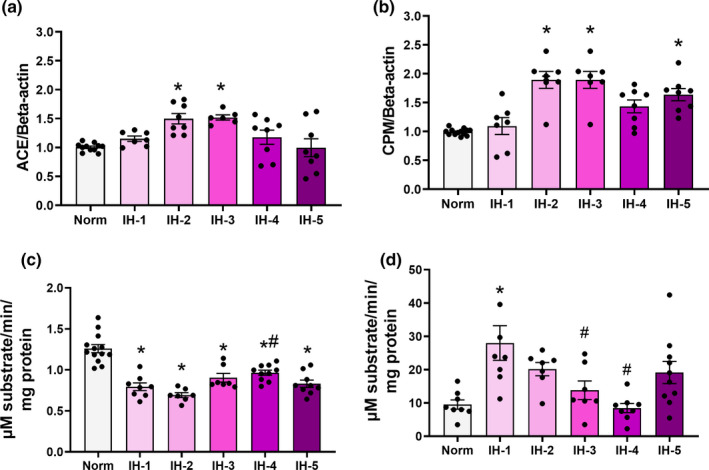
FIGURE 8.

ACE and CPM gene expression and protein activity in left ventricular myocardium by duration intermittent hypoxia. Plot of ACE (a) and CPM (b) mRNA expression as determined by real‐time PCR (N = 8–12/group). ACE (c) and CPM (d) activities (N = 8–14/group). (a) *Different from normoxia (p = 0.04). (b) *different from normoxia (p = 0.012). (c) *Different from normoxia (p < 0.001), # different from 2 weeks of IH (p = 0.002). (d) *Different from normoxia (p = 0.001), # different from 1 week of intermittent hypoxia: IH‐1 vs. IH‐3, p = 0.03; IH‐1 vs. IH‐4, p < 0.001. Data are mean ± SEM
