
FIGURE 3.
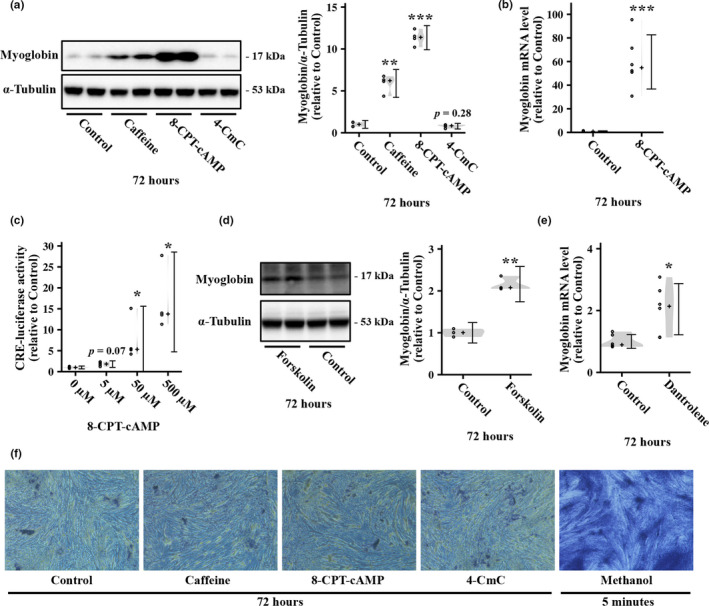
Effect of cyclic AMP (cAMP) and calcium signal activation on myoglobin expression in L6 myotubes. (a) L6 myotubes were stimulated with 5 mM caffeine, 0.25 mM 8‐CPT‐cAMP, or 0.5 mM 4‐CmC for 72 h, and then, myoglobin protein level was measured by western blotting (n = 4 per group). Representative immunoblots and quantification of protein expression levels of myoglobin are shown. (b) L6 myotubes were stimulated with 8‐CPT‐cAMP for 72 h, and then, myoglobin mRNA level was measured by real‐time PCR (n = 6 per group). (c) L6 myoblasts were incubated with 0, 5, 50, or 500 µM 8‐CPT‐cAMP for 6 h, and CRE‐luciferase activity was then measured by luciferase assay (n = 3 per group). (d) L6 myotubes were stimulated with 10 µM forskolin for 72 h, and then, myoglobin protein level was measured by western blotting (n = 3 per group). Representative immunoblots and quantification of protein expression levels of myoglobin are shown. (e) L6 myotubes were stimulated with 10 µM dantrolene for 72 h, and the myoglobin mRNA level was then measured by real‐time PCR (n = 6 per group). (f) After being treated for 72 h with 5 mM caffeine, 0.25 mM 8‐CPT‐cAMP, or 0.5 mM 4‐CmC, the myotubes were stained with trypan blue. Methanol treatment for 5 min, which induces considerable cell death, was used for the positive control. Distributions of values are depicted as violin plots; dot plots represent individual data points; cross signs depict the median in each group; error bars show 95% confidence interval. * p < 0.05, ** p < 0.01, *** p < 0.001 versus Control. Statistical significance was assessed by (a) parametric or (c) nonparametric multiple comparison tests with the Benjamini–Hochberg method or (b, d, and e) Welch's t test.