
FIGURE 2.
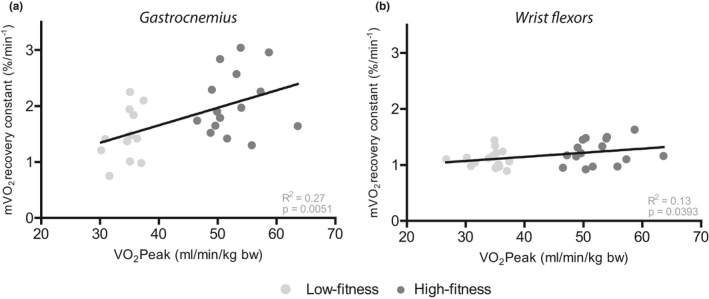
Correlation between maximal oxygen consumption (O2Peak) measured during an incremental exercise test and recovery constants for muscle oxygen consumption recovery (mO2) measured using NIRS in gastrocnemius (a) calculated after 30 s of plantar flexion and wrist flexors (b) calculated after 30 s of handgrip exercise at 50% of MVC in the high‐fitness (dark grey) and low‐fitness (light grey) group