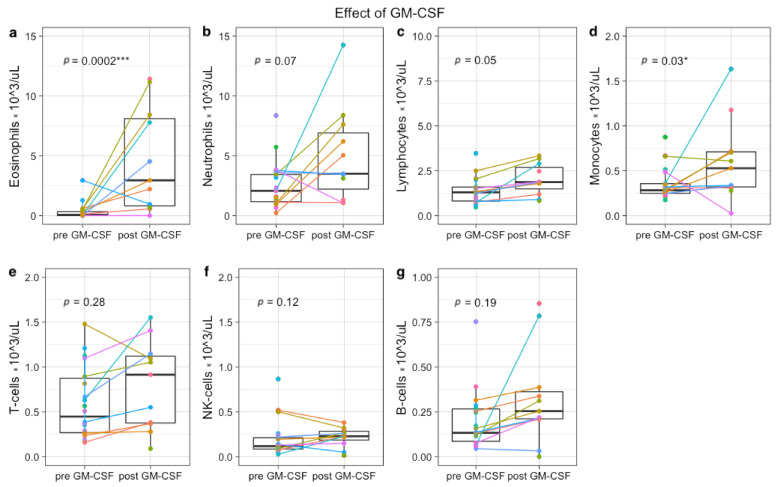
Figure 3.
Immune profiles before and after GM-CSF-containing immunotherapy cycle. Each colored dot indicates absolute counts from one patient (×103 cells/uL). From 5 patients, samples were paired before GM-CSF (day 1 IT cycle 1, 3 or 5) and after GM-CSF (day 15 IT cycle 1, 3 or 5). In total, 9 paired samples are depicted (colored lines), because two patients were monitored during all 3 GM-CSF cycles. Twelve single measurements from 12 other patients were included, resulting in a total of 17 patients (11 in study, 6 left over material during IT). Absolute eosinophil (a), neutrophil (b), lymphocyte (c), monocyte (d), T-cell (e), NK-cell (f), and B-cell numbers (g) are shown. * p < 0.05, *** p < 0.0001.

