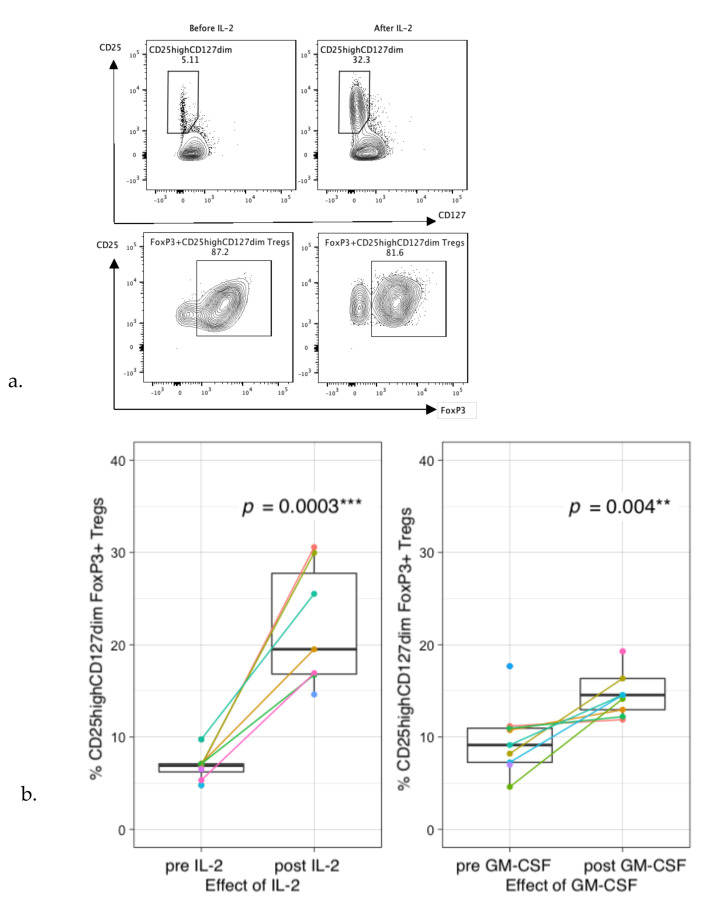
Figure 7.
Regulatory T-cell profiles and their suppressive capacity during immunotherapy. (a) Example of gating of CD25highCD127dim cells within the CD3+CD4+ T-cell population (upper panels) and gating of FoxP3 within the CD25highCD127dim cell population before and after IL-2 administration (lower panels). (b) Percentages of Tregs (within CD3+CD4+ T-cell population) increase 4–5-fold after IL-2 administration (left) and increase 1–2-fold after GM-CSF administration (right). (c) Plasma IL-10 levels pre- and post-IL-2 (p = 0.339) (left) and GM-CSF (p = 0.144) (right). Protein expression is shown as normalized protein expression (NPX). IL-2: In total, 5 paired samples are shown, as two patients were monitored during both IT cycles. GM-CSF: In total, 7 paired samples are shown, as two patients were monitored during all three IT cycles. Two single measurements from patients pre-GM-CSF were included, resulting in a total of 9 patients pre- and 7 post-GM-CSF. (d) CTV staining of PBMCs of a healthy donor co-cultured without Tregs (grey), with patient Tregs (green), or healthy-donor Tregs (blue), or unstimulated (red) at an effector-to-target ratio of 2:1. (e) Relative percentages of proliferation of HD CD3+ T-cells co-cultured with patient Tregs (blue) or HD Tregs (green) compared to proliferation without Tregs (red). CD3+ T-cell proliferation was measured in patient 1 (during cycle 2 and 4), patient 2 (during cycles 1, 2 and 5) and patient 3 (during cycle 1 and 2). HD = healthy donor, PT = patient. ** p < 0.001, *** p < 0.0001.


