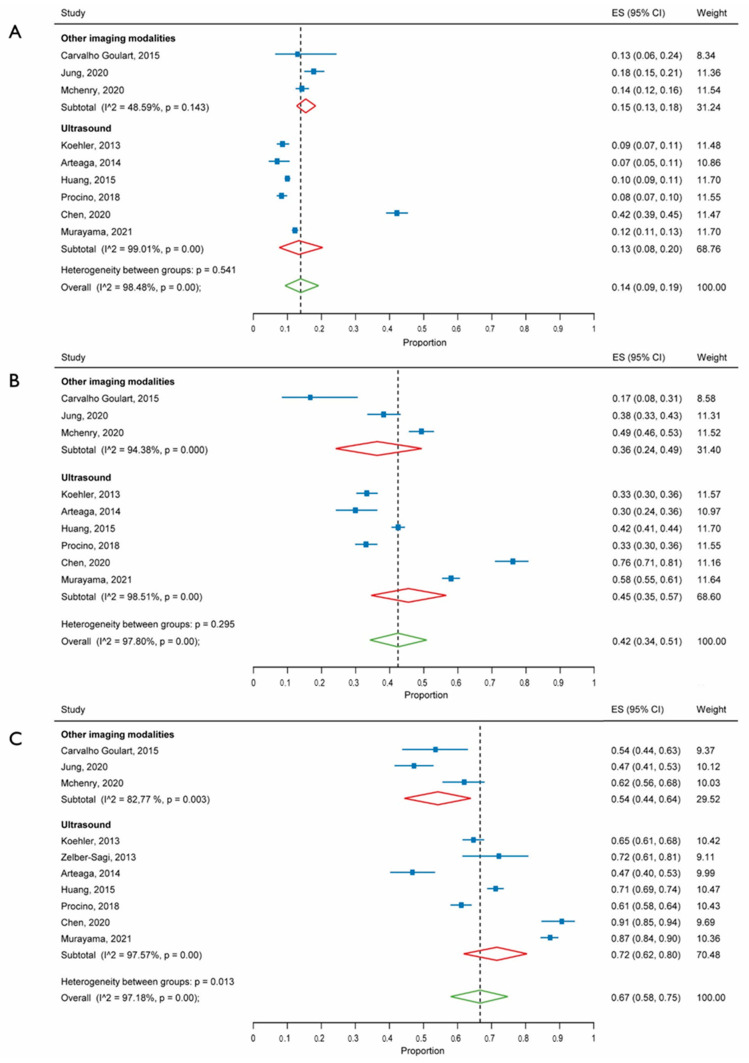
Figure 1.
Forest plot of the prevalence of non-alcoholic fatty liver disease in subjects with fatty liver index below 30 (A), between 30 and 60 (B), or 60 or higher (C). 95% CI, 95% confidence interval. References: Koehler, 2013 [12], Zelber-Sagi, 2013 [13], Arteaga, 2014 [14], Carvalho Goulart, 2015 [15], Huang, 2015 [16], Procino, 2018 [17], Chen, 2020 [18], Jung, 2020 [19], McHenry, 2020 [20], Murayama, 2021 [21].

