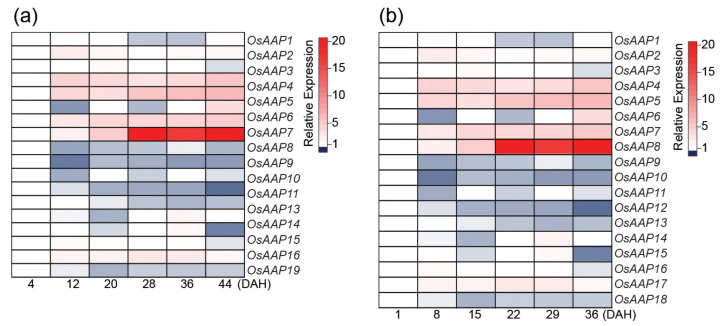
Figure 2.
Heat map of the expression of the rice AAPs (amino acid permease, OsAAPs) during leaf senescence. Expression data were from RNA-seq analysis (a) [20] and microarray data (b) [21]. Gene nomenclature of each gene was followed in the previous report [120]. Relative expression levels were quantified as describes in Figure 1.

