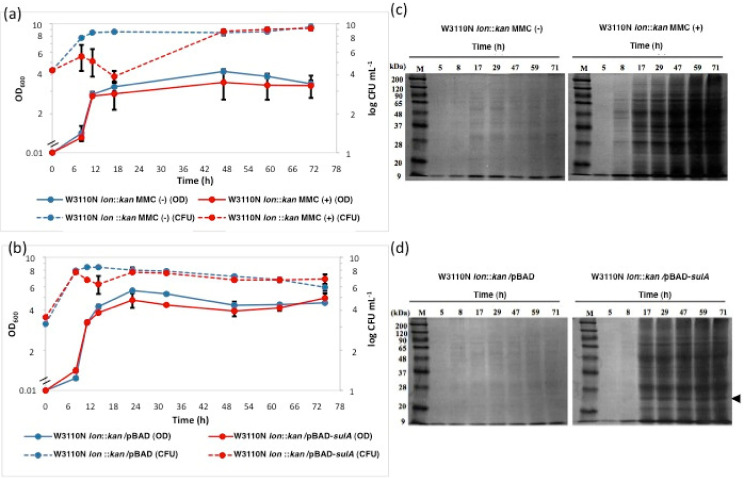
Figure 1.
Effects of mitomycin C and overexpression of sulA on cell growth and cell lysis. W3110N lon::kan cells were grown in LB medium containing kanamycin (a) and W3110N lon::kan cells harboring pBAD24 or pBAD-sulA (b) were grown in LB medium containing ampicillin and kanamycin, and mitomycin C (MMC) and L-arabinose were added at 5 h (OD600 of about 0.5) at the final concentrations of 0.1 μg/mL and 0.1%, respectively. Cell turbidity (straight lines) and colony forming units (CFU) (dotted lines) were determined. Red circles and blue circles in (a) represent conditions with and without MMC, respectively; red circles and blue circles in (b) represent W3110N lon::kan cells harboring pBAD-sulA and W3110N lon::kan cells harboring pBAD24, respectively. Proteins from the medium fractions of cultures of W3110N lon::kan cells with and without MMC (c) and of W3110N lon::kan cells harboring pBAD-sulA and W3110N lon::kan cells harboring pBAD24 (d) were recovered and subjected to SDS-PAGE as described in the Materials and Methods Section. An arrowhead indicates the position of the size of SulA (18.8 kDa). Lane M is molecular markers. Error bars stand for ± SD.

