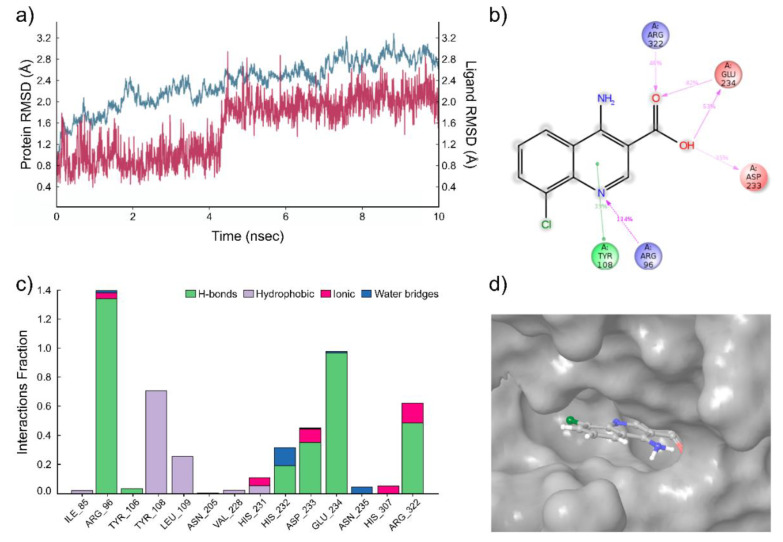
Figure 3.
Results of the molecular dynamics simulation of the FTO complex with compound 2. (a) The protein and ligand position root mean square deviation (RMSD) plot against time in the case of the FTO complex with compound 2 for a representative 10 ns run. (b) Desmond 2D profile data for the compound 2 binding to FTO protein. (c) Normalized stacked bar chart representation of interactions and contacts over the course of trajectory (values over 1.0 are possible as some residues make multiple contacts of same subtype with ligands); interactions occurring more than 50% of the simulation time. Interaction diagram between the compound 2 and FTO protein. (d) The position of the compound 2 in the structure of FTO, related to Figure 1a.

