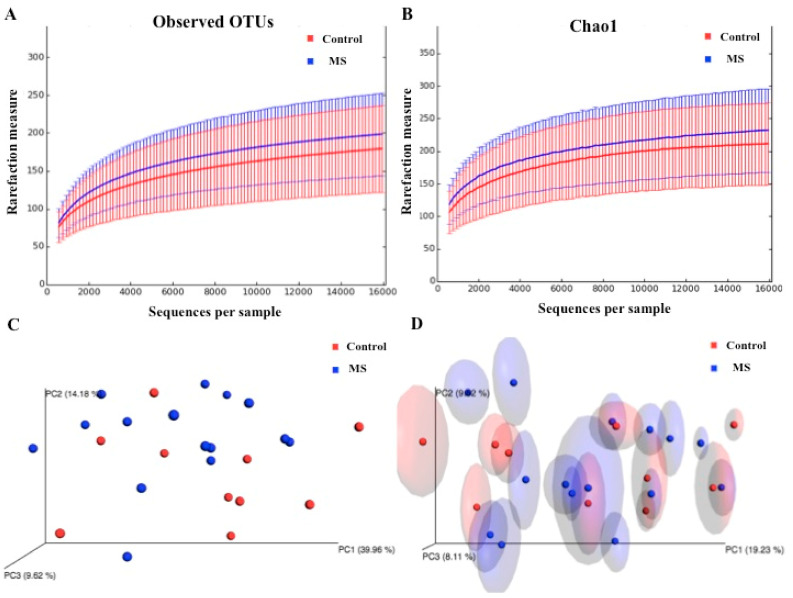
Figure 1.
Alpha and beta diversity in the gut microbiota of RRMS patients receiving DMTs and that of healthy controls. Rarefaction curves are a representation of species richness for a given number of individual samples: (A) Observed and (B) Chao 1-estimated OTUs. Principal component analysis (PcoA) is a transformation of weighted or unweighted Unifrac distance, a pair-wise distance between samples based on the calculation of the shared branches of the phylogenetic tree of the representative rRNA genes from OTUs present in at least one sample: (C) PcoA plot with weighted and (D) unweighted UniFrac metric with Bonferroni’s correction.

