FIGURE 1.

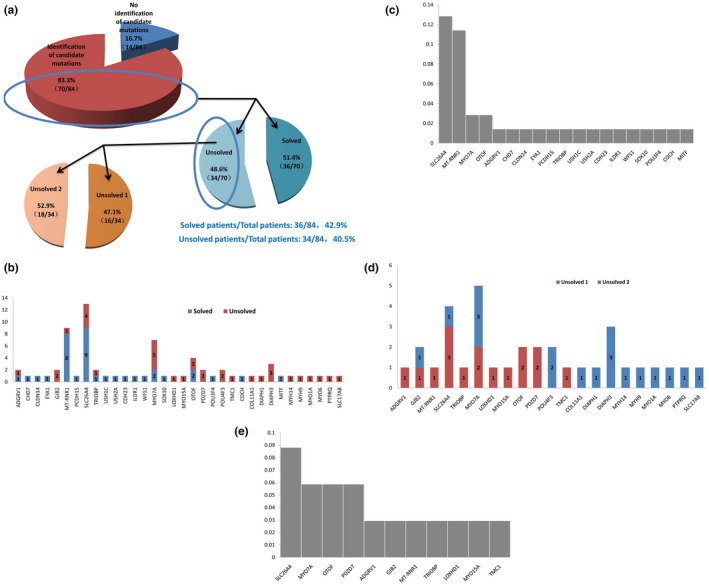
(a) Percentage of patients in “Solved” and “Unsolved” groups. (b and c). Candidate causative genes in “Solved” and “Unsolved” groups. The number of patients was annotated in each gene group. (d and e) Candidate causative genes in “Unsolved1” and “Unsolved2” groups. The number of patients was annotated in each gene group.
