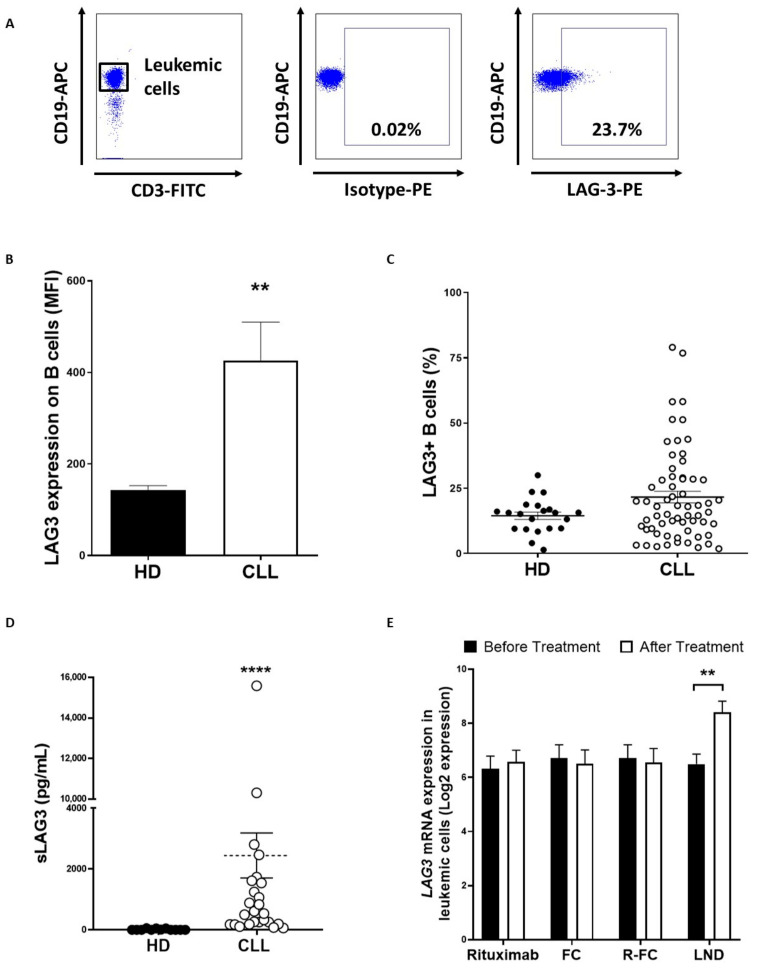
Figure 1.
LAG-3 expression is upregulated on leukemic cells from patients with CLL. LAG-3 surface expression was evaluated on PBMCs from patients with CLL (n = 61) and HD (n = 20) by flow cytometry. (A) Representative dot plot for LAG-3+ CD19+ analysis; (B) Comparison of LAG-3 expression (MFI ± SEM) between leukemic cells and B lymphocytes from HD; (C) Percentage of LAG-3+ leukemic cells compared to B cells from HD; (D) Sera levels of sLAG-3 were evaluated in 28 patients with CLL and 12 HD; (E) In silico analysis of the effect of the indicated therapies on LAG3 mRNA expression in leukemic cells. GSE112953 and GSE58211 from GEO database were included. Each dot represents an individual sample (FC: fludarabine-chlorambucil, R-FC: Rituximab- fludarabine-chlorambucil, LND: lenalidomide). ** p < 0.01 and **** p < 0.0001.

