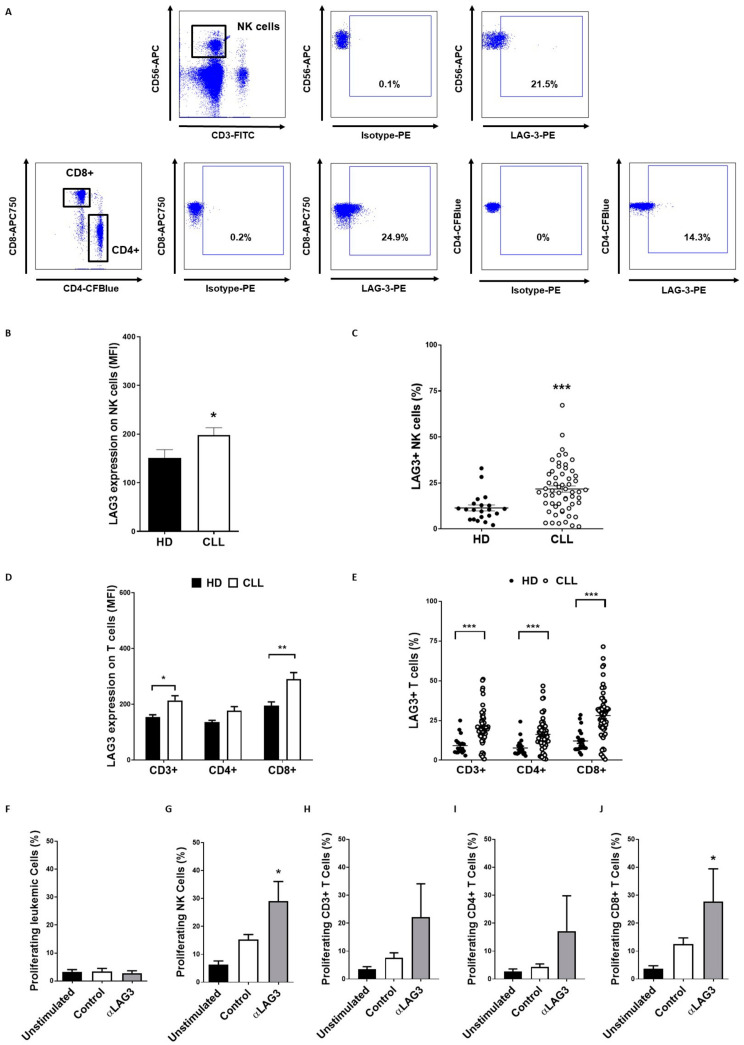
Figure 4.
LAG-3 expression is increased on NK and T cells and induces immunosuppression. (A) Representative dot plots of percentage of LAG-3+ NK and CD8+ T cells in PBMCs from patients with CLL; LAG-3 surface expression was evaluated in 59 patients and 20 healthy donors in NK (B,C) and T cells (D,E) by flow cytometry. The graphs represent MFI ± SEM and percentage of LAG-3+ cells; The effect of LAG-3 blockade with relatlimab or isotype control (Control; 10 µg/mL) on the proliferation of leukemic cells (F), NK cells (G) or T cells (H–J) stimulated with 50 U/mL IL-2 was evaluated by CFSE staining and flow cytometry (n = 6). * p < 0.05, ** p < 0.01 and *** p < 0.001.

