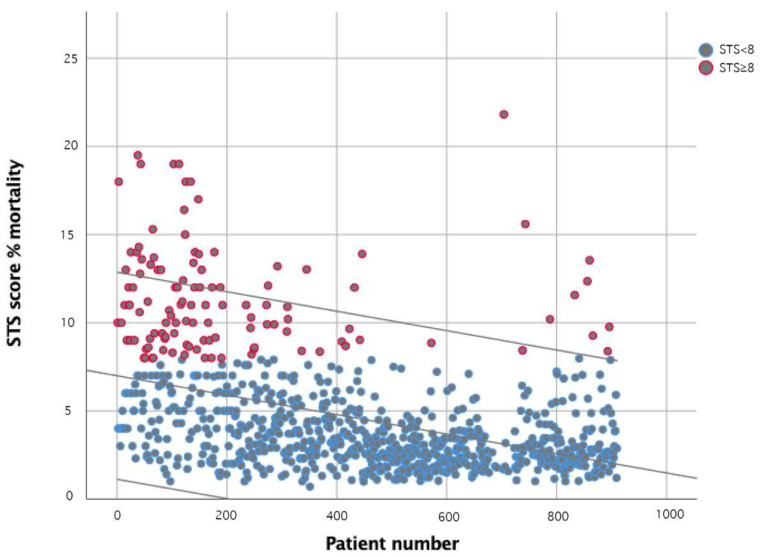
Figure 1.
STS Score over time. Scatterplot with interpolation line, demonstrating the reduction of the patient’s risk as defined by STS score over time, from patients 1–910. Individual patients are represented by circles and divided into either a low-intermediate risk group (STS < 8) or high-risk group (STS ≥ 8).

