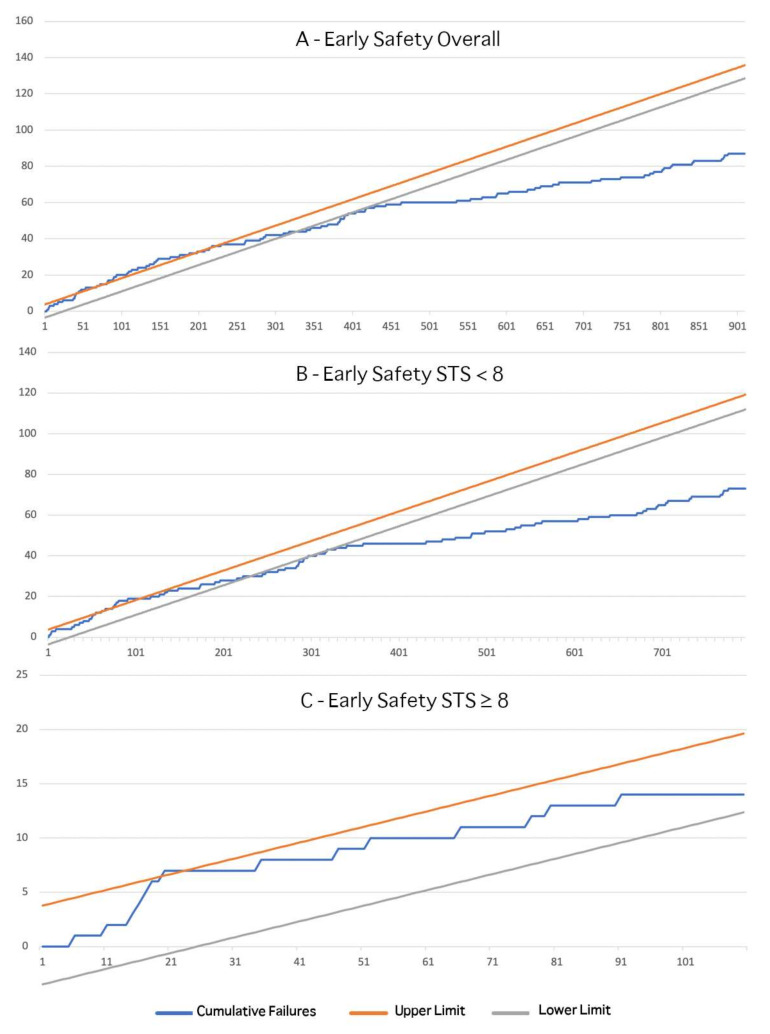
Figure 3.
CUSUM Analysis for early safety. Incremental line represents unadjusted cumulative sum of failures. Lower and upper limits are calculated upon acceptable and unacceptable failure rates of 10 and 20%, respectively. Observations above the upper limit indicate out of control procedure, while observation below the lower limit suggest better-than-expected results (proficiency). CUSUM analyses are provided for the overall population (A), low-intermediate risk (B) and high-risk subgroups (C).

