
Figure 6.
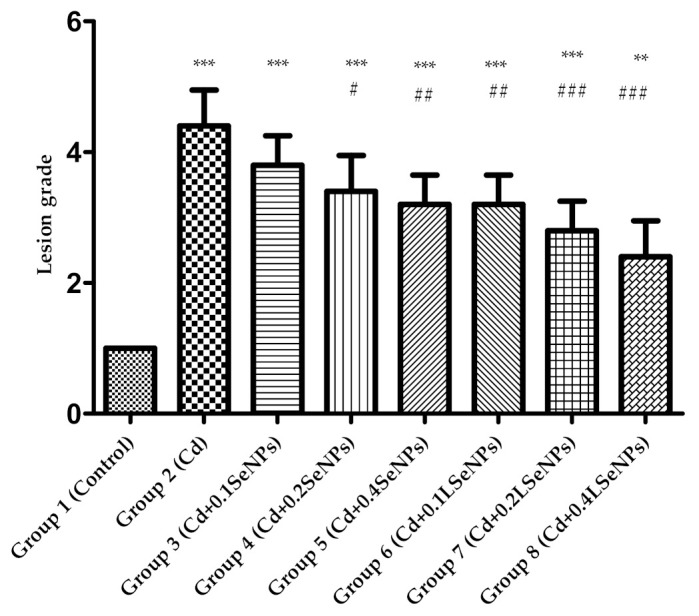
Semi-quantitative assessment of the severity of liver damage ranked from 1 (control status) to 5 (liver damage) induced by cadmium under the protection of SeNPs and LSeNPs. Groups: 1—control; 2—CdCl2; 3—CdCl2 + 0.1 mg/kg SeNPs; 4—CdCl2 + 0.2 mg/kg SeNPs; 5—CdCl2 + 0.4 mg/kg SeNPs; 6—CdCl2 + 0.1 mg/kg LSeNPs; 7—CdCl2 + 0.2 mg/kg LSeNPs; 8—CdCl2 + 0.4 mg/kg LSeNPs. ** p < 0.01; *** p < 0.001 compared to control group (group 1); # p < 0.05; ## p < 0.01; ### p < 0.001 compared to Cd group (group2).