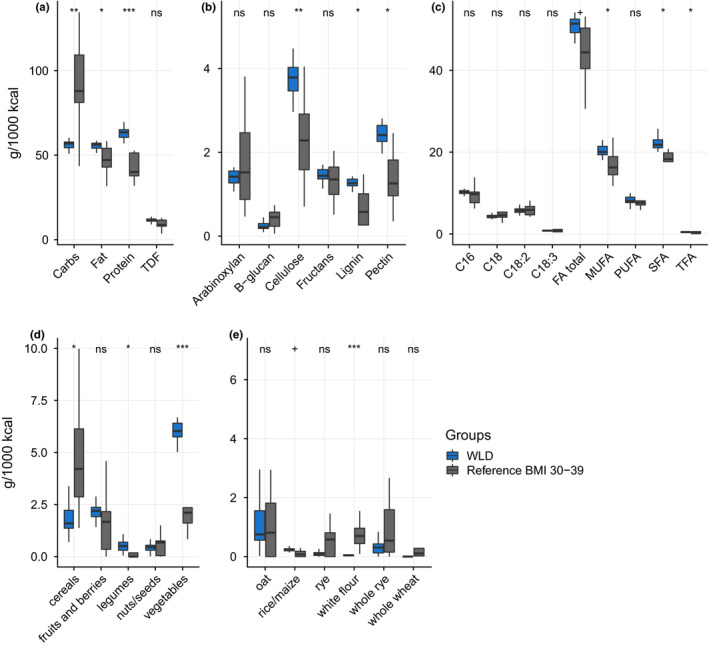
FIGURE 2.

Nutritional and food intake in the WLD, and obese reference group. (a) macronutrients and total DF; (b) specific DF categories; (c) fatty acid profile; (d) main total DF sources; (e) main cereal DF sources. All values are g per 1000 kcal per day. Outliers are not shown
