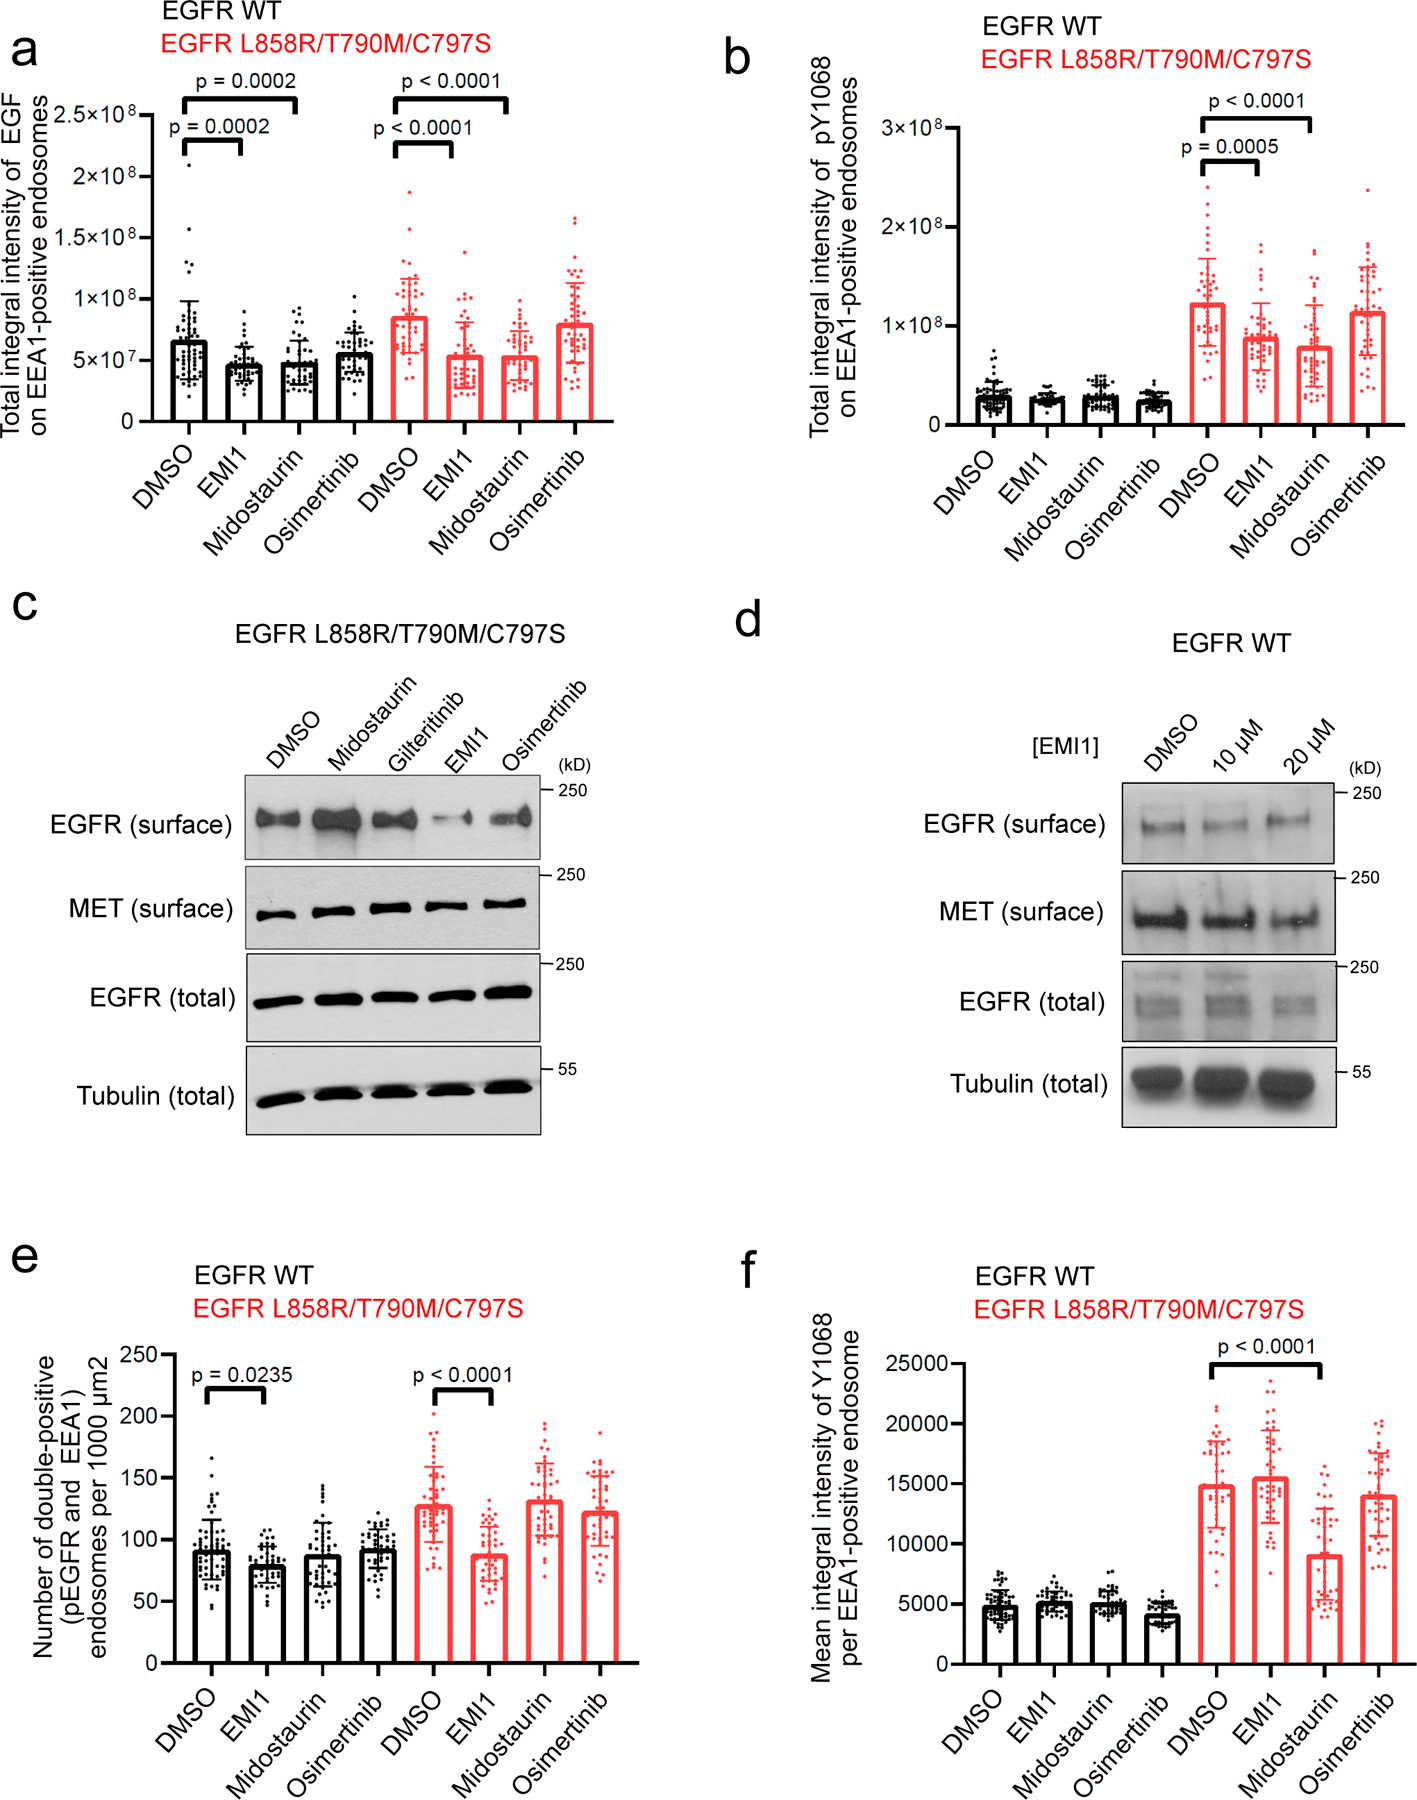
Figure 4.

Investigating effect of EMI1 on activated EGFR L858R/T790M/C797S endosomal trafficking. (a) Total integral intensity of EGF on EEA1-positive endosomes normalized on cytoplasm area after 30 minutes of EGF stimulation upon 1 µM compound treatment in HEK293 EGFR WT cells or EGFR L858R/T790M/C797S cells. (b) Total integral intensity of pY1068 on EEA1-positive endosomes normalized on cytoplasm area after 30 minutes of EGF stimulation with 1 µM compound treatment in HEK293 EGFR WT cells or EGFR L858R/T790M/C797S cells. Results are shown as dot plots representing the average ± SD. For EGFR WT cells, n = 63, 46, 48 and 48 images were analyzed for DMSO, EMI1, midostaurin and osimertinib treatment, respectively. For EGFR-C797S cells, n = 48, 46, 46, 48 images were analyzed for DMSO, EMI1, midostaurin and osimertinib treatment, respectively. Significant p-values are displayed and were calculated using the Dunn’s multiple comparison test. (c) Cell surface biotinylation assay assessing surface levels of EGFR L858R/T790M/C797S after treatment with 5 µM compound for 2 hours. Results are representative of at least two independent experiments. (d) Cell surface biotinylation assay assessing surface levels of EGFR WT after treatment with EMI1 for 2 hours. Results are representative of at least two independent experiments (see Supplementary Fig. 26 for source blot images). (e) Number of pEGFR and EEA1 double-positive endosomes per 1000μm2 after 30 min stimulation by EGF. (f) Mean integral intensity of pEGFR on double-positive (pEGFR and EEA1) endosomes after 30 min stimulation by EGF. Results are shown as dot plots representing the average ± SD. For EGFR WT cells, n = 63, 46, 48 and 48 images were analyzed for DMSO, EMI1, midostaurin and osimertinib treatment, respectively. For EGFR-C797S cells, n = 48, 46, 46, 48 images were analyzed for DMSO, EMI1, midostaurin and osimertinib treatment, respectively. Significant p-values are displayed and were calculated using the Dunn’s multiple comparison test.
