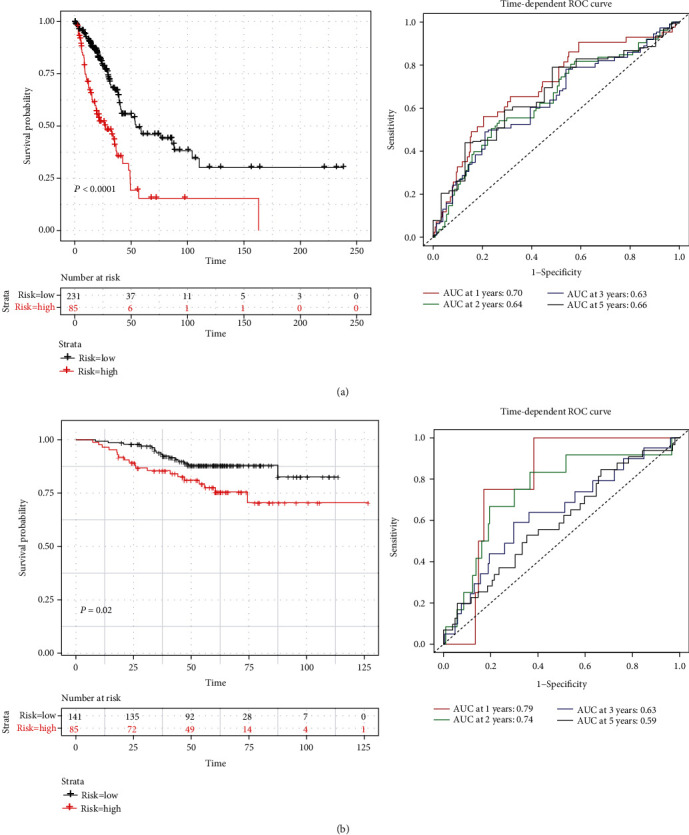
Figure 3.

K-M and time-dependent ROC curves for the prognostic model in the TCGA-LUAD cohort (a) and the GEO-LUAD cohort (b). The K-M survival curves showed the overall survival based on the relatively high- and low-risk patients classified by the optimal cut-off value. The time-dependent ROC curve analyses of survival prediction by the prognostic model. LUAD: lung adenocarcinoma; ROC: receiver operating characteristic.
