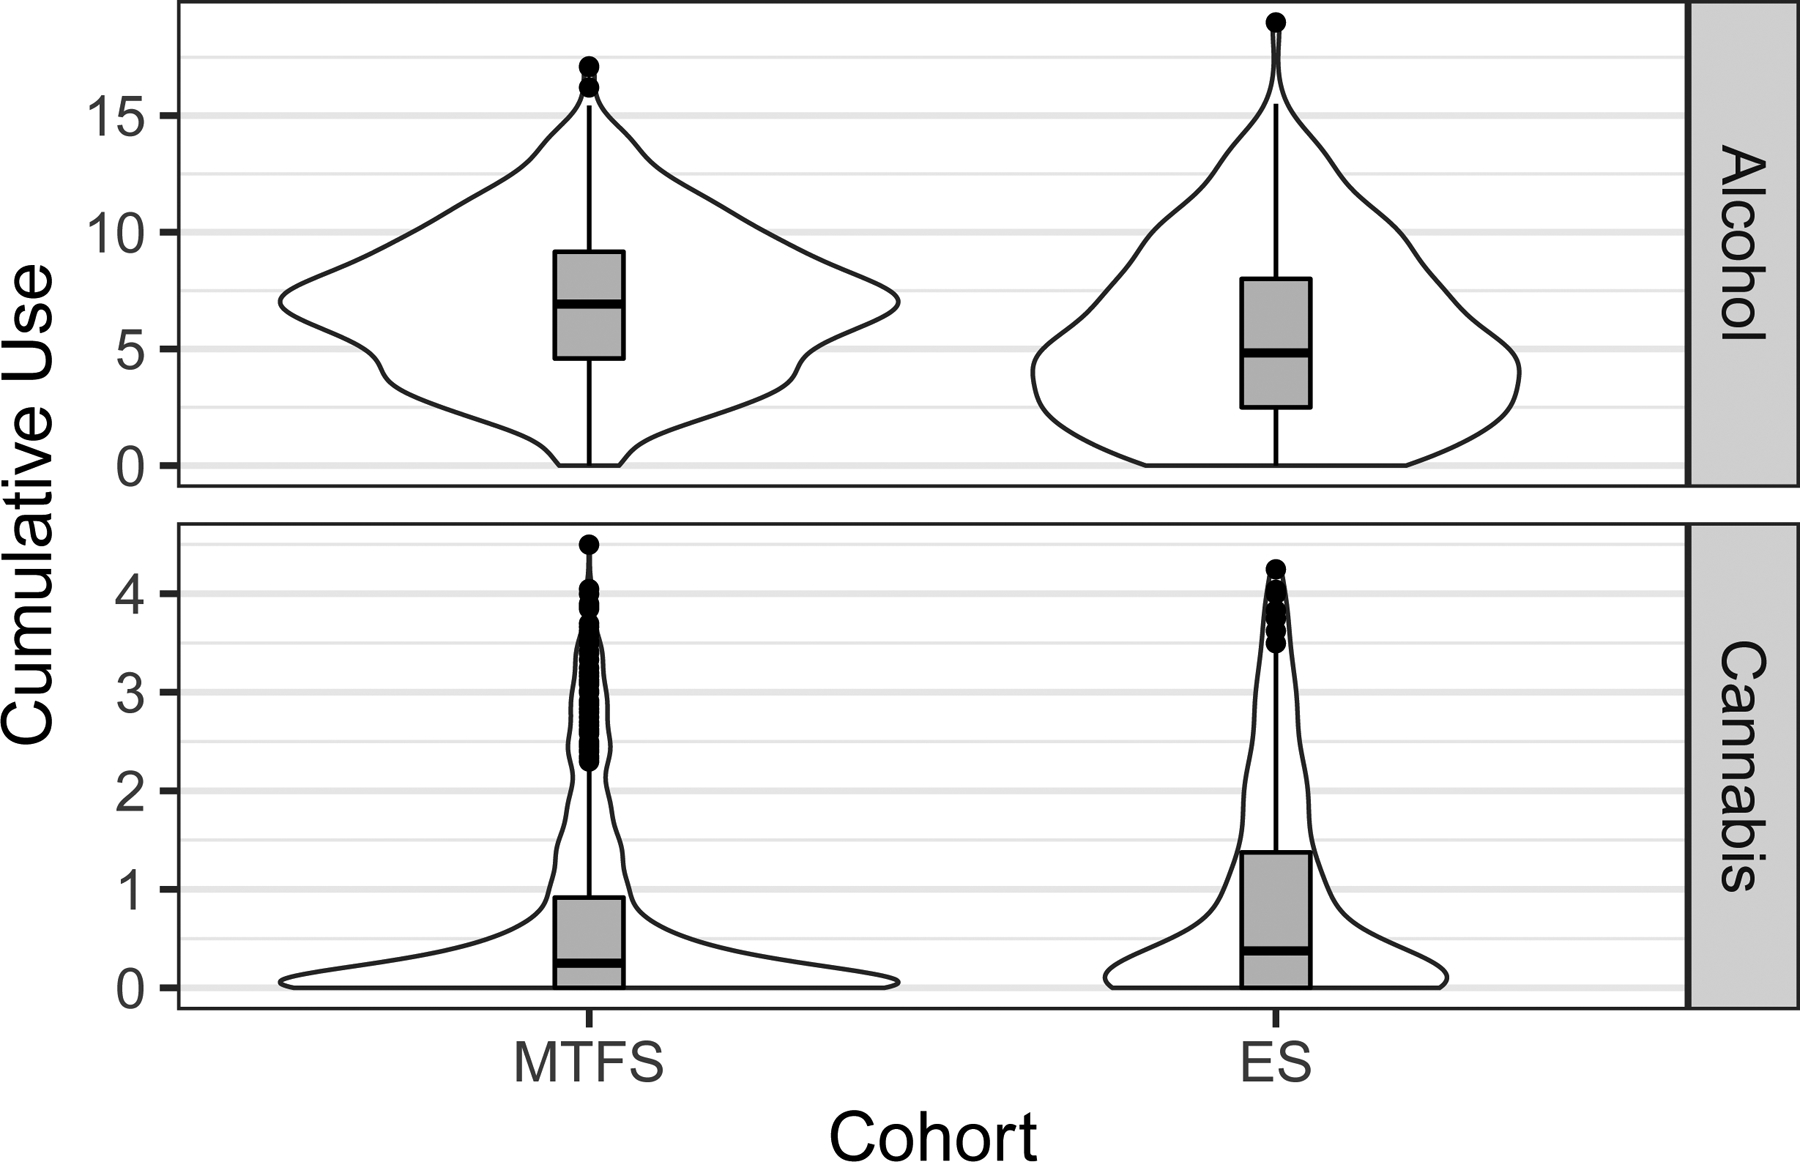
Fig 1.

The distribution of cumulative drinking and cannabis scores. These are provided separately for the two cohorts (MTFS and ES) and in two forms, with box plots inside violin plots. The box spans the first and third quartiles of the distribution, while the interior line of the box plot represents the median.
