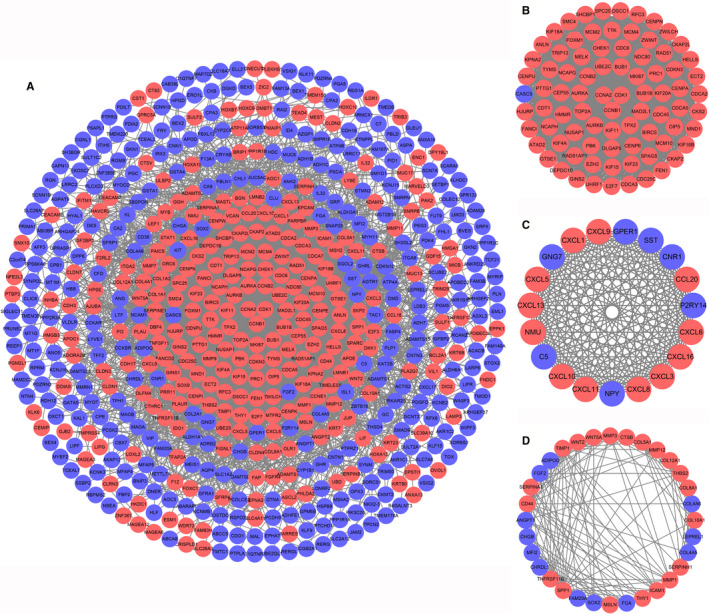
Figure 3.

PPI network of all the co‐regulated DEGs and top 3 key modules. Up‐regulated genes are marked with red and down‐regulated genes are marked with blue. (A) PPI network of all the co‐regulated DEGs. (B) The key module 1. (C) The key module 2. (C) The key module 2
