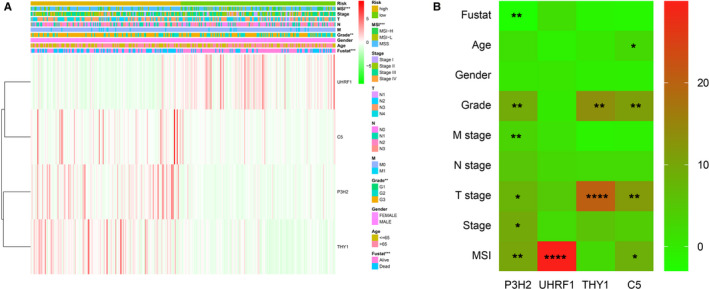
Figure 7.

Correlation of risk value and four hub genes with clinical case characteristics. (A) Heat map of the correlation between risk value and clinical case characteristics. (B) Heat map of the correlation between the four hub genes and clinical case characteristics. *P < 0.05, **P < 0.01, ***P < 0.001, ****P < 0.0001
