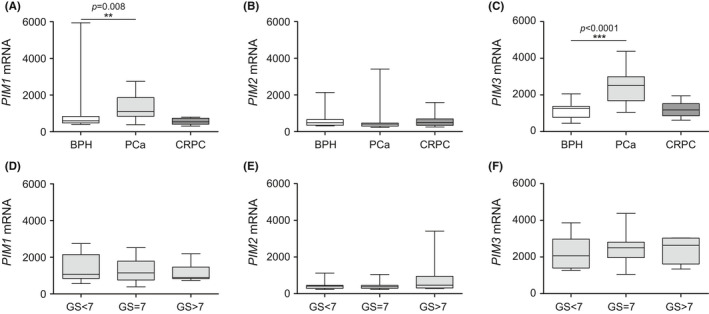
FIGURE 1.

Expression of PIM1 and PIM3 is elevated in primary PCa. The Tampere PCa sequencing dataset 19 was used to assess the mRNA expression levels of the PIM1 (A, D), PIM2 (B, E), and PIM3 (C, F) genes. The results were first categorized into BPH (n = 12), primary PCa (n = 30), and CRPC (n = 13) samples (A–C). Primary PCa samples were further divided based on Gleason scores GS<7 (n = 7), GS = 7 (n = 7), and GS>7 (n = 15) (D–F). Error bars display the minimum and maximum values, and the line inside the boxes displays the median in the dataset range. p‐values <0.05 (*), p‐values <0.01 (**), and p‐values <0.001 (***) were considered statistically significant
