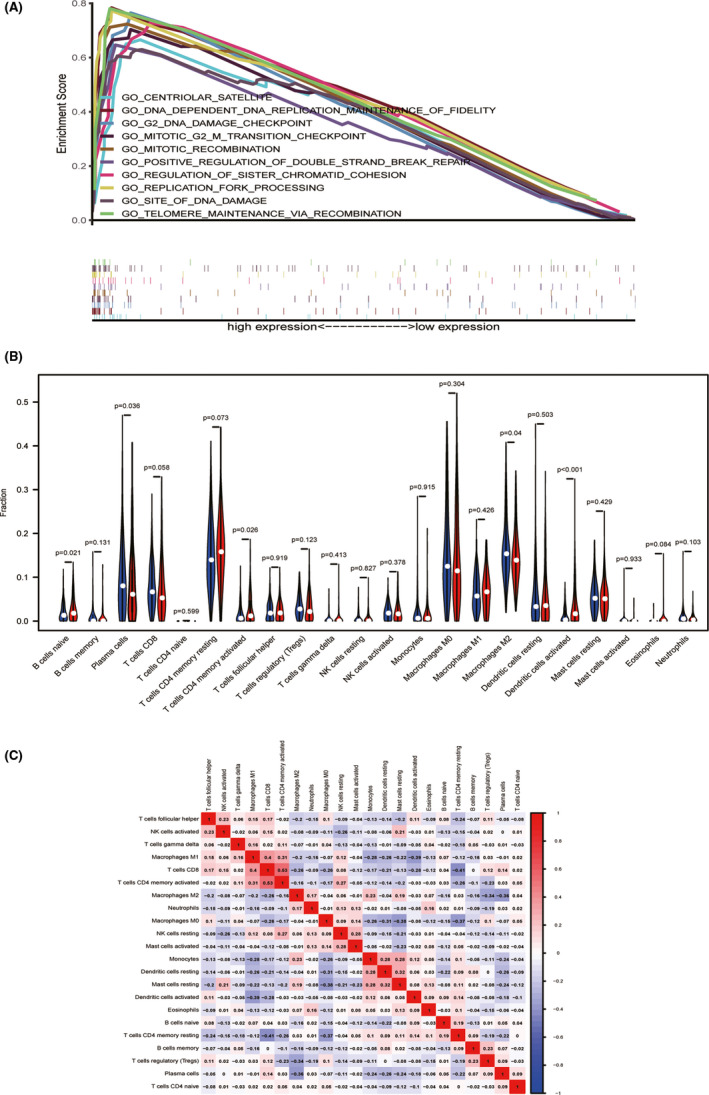
FIGURE 3.

A, GO term analysis showed 10 positive correlation groups. B, The proportion of 22 immune cell subtypes in high and low NUP62CL expression group. Red indicated high expression and blue indicated low expression. C, Heatmap of 22 immune infiltration cells in LUAD samples
