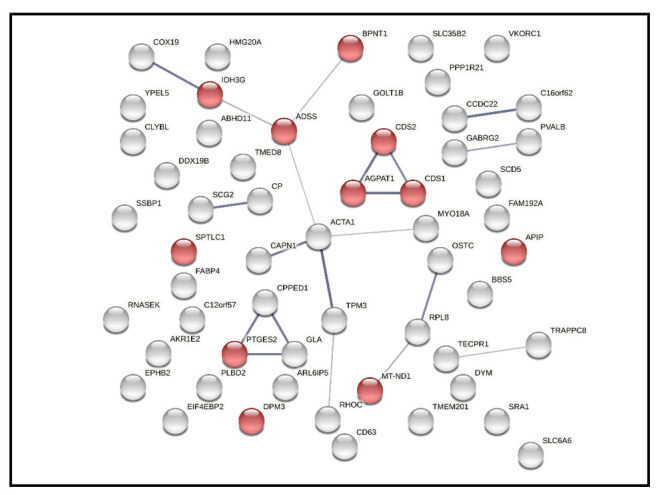
Figure 4.

Network analysis of 58 differentially expressed retinal proteins, including 56 nodes (gene names) and 20 edges (predicted functional associations). The closely related proteins are linked by lines, while red color represent proteins associated with metabolic pathways.
