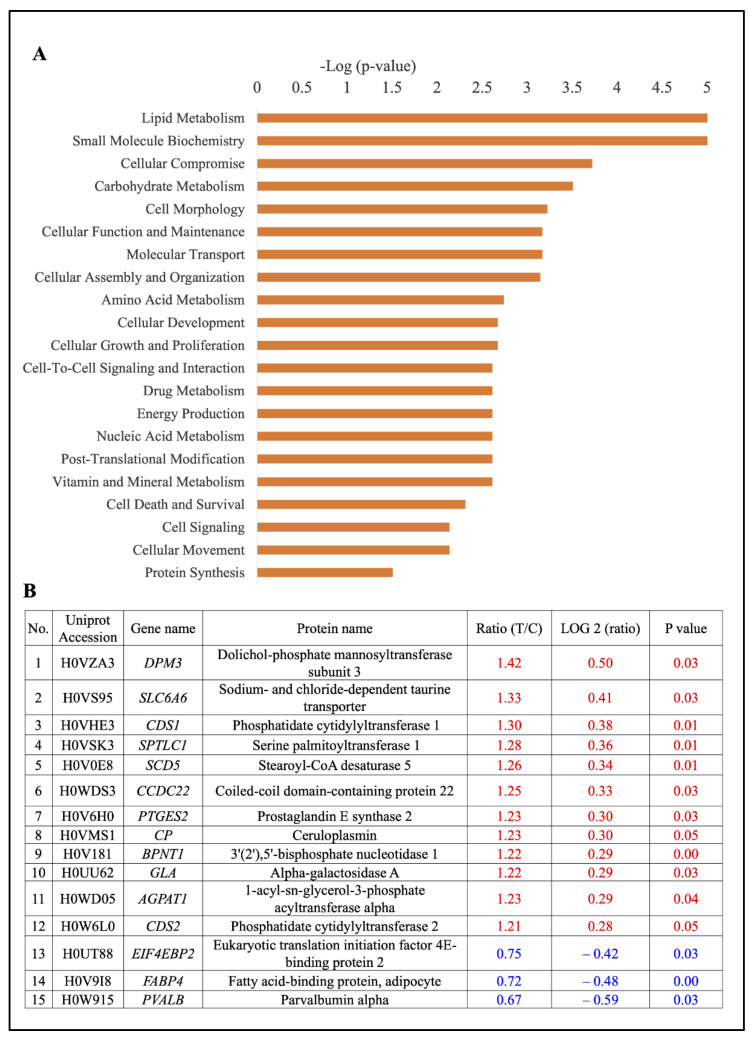
Figure 5.
(A) Molecular and cellular functions (per GO analysis) significantly associated with the 58 differentially expressed proteins. (B) Differentially expressed proteins involved in lipid metabolism. The fold-change (FC), log2 (FC), and p values in red belong to up-regulated proteins, and the values in blue belong to down-regulated proteins.

