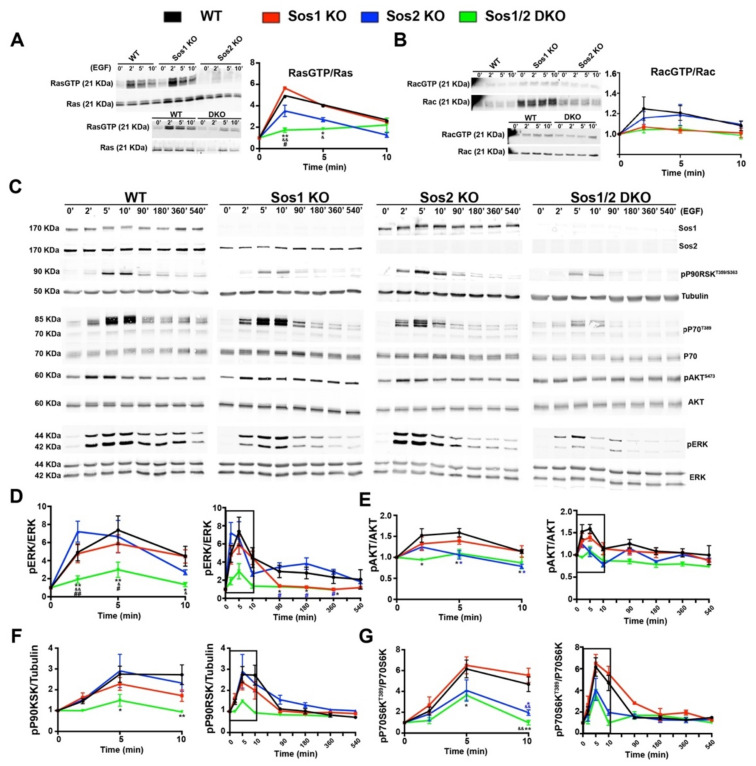
Figure 3.
Analysis of short-term and long-term signaling through the EGRF-SOS-RAS axis in primary keratinocytes. Representative Western blot images showing RasGTP/Ras (A), RacGTP/Rac (B,C) Sos1, Sos2, pP90T359/S363, tubulin, pP70T389, total P70, pAKTS473, total AKT, pERK, and total ERK protein expression upon EGF stimulation at the indicated time points in primary keratinocytes of the four defined genotypes. The graphs represent quantitation of ratios of RasGTP/Ras (A), RacGTP/Rac (B), pERK/ERK (D), pAKTS473/AKT (E), pP90RSK T359/S363/tubulin (F), and pP70T389/P70 (G) ratios at short-term and long-term. Boxed areas in graphs indicate the same data shown in middle panels. Data expressed as the mean ± SD. n = 9/genotype. (A) * p < 0.05 vs. WT; ** p < 0.01 vs. WT; & p < 0.05 vs. Sos1 KO; && p < 0.01 vs. Sos1 KO; # p < 0.05 vs. Sos2 KO. (D) * p < 0.05 vs. WT; ** p < 0.01 vs. WT; p < 0.05 vs. Sos1 KO; && p < 0.01 vs. Sos1 KO; # p < 0.05 vs. Sos2 KO; # (in blue) p < 0.05 vs. Sos2 KO; ## p < 0.01 vs. Sos2 KO. (E) * p < 0.05 Sos1/2 DKO vs. WT; * (in blue) p < 0.05 Sos2 KO vs. WT. (F) * p < 0.05 vs. WT; ** p < 0.01 vs. WT. (G) * p < 0.05 Sos1/2 DKO vs. WT and Sos1 KO; * (in blue) p < 0.05 Sos2 KO vs. WT and Sos1 KO; ** p < 0.01 vs. WT and Sos1 KO; && p < 0.01 vs. WT and Sos1 KO; && (in blue) p < 0.01 Sos2 KO vs. WT and Sos1 KO.

