Figure 5.
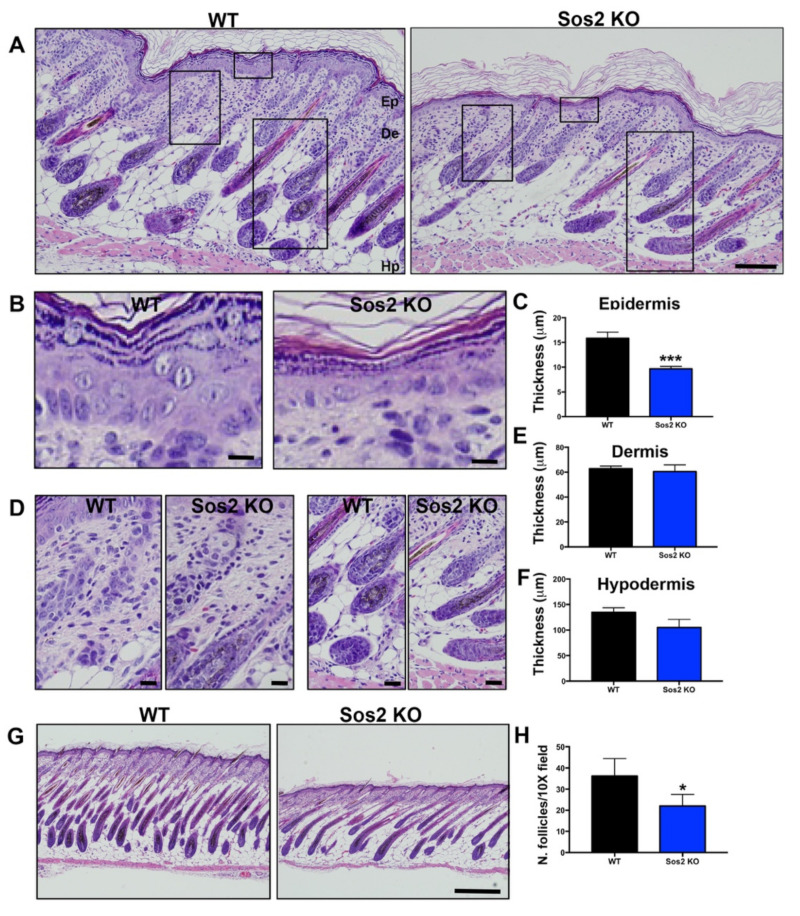
Histological analysis of overall skin architecture in newborn WT and Sos2 KO mice. (A) Representative images of H&E-stained, paraffin-embedded sections of skin from newborn WT and Sos2 KO mice. Scale bar: 50 μm. Ep, epidermis; De, dermis; Hp, hipodermis. (B,D) Higher magnification of boxed areas marked in panel A, focusing on the epidermis (B), dermis (left panel in (D)), and hypodermis (right panel in (D)) of each of the indicated genotypes. Scale bars (B,C): 10 μm. (C,E,F) Bar plots quantitating thickness of the epidermis (C), dermis (E), and hypodermis (F) layers of the skin of newborn mice of the indicated genotypes. (G) Representative images of H&E-stained sections from the dorsal skin of neonate WT and Sos2 KO mice. Scale bar: 200 μm. (H) Bar plots represent average of number of follicles per 10× field in the WT and Sos2 KO dorsal skin of neonatal mice. Unfortunately, the embryonal lethality of Sos1 KO mice prevents carrying out similar analyses to evaluate the role of Sos1 in the skin of newborn mice. Data are expressed as means ± the SD. n = 4/genotype. * p < 0.05 vs. WT; *** p < 0.001 vs. WT.

