Figure 6.
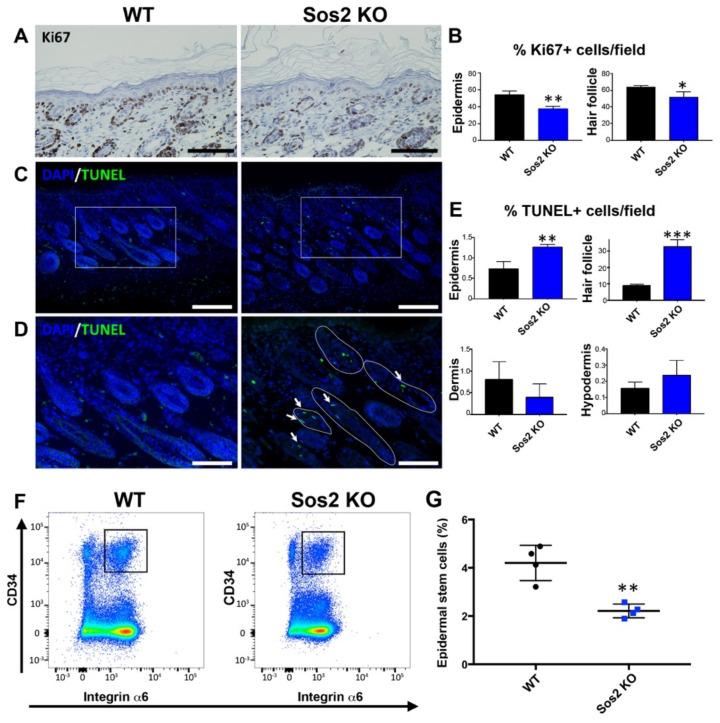
Specific alterations of cellular proliferation, survival, and stem cell population in the skin of newborn Sos2 KO mice. (A) Representative images of skin sections of newborn WT and Sos2 KO mice immunostained for Ki67. Scale bars: 50 μm. (B) Quantitation of percentage of Ki67+ cells per field counted in the epidermis and hair follicles of the indicated Sos genotypes. * p < 0.05 vs. WT, ** p < 0.01 vs. WT. (C) Confocal images of skin sections from animals of the two defined genotypes labeled for TUNEL (green) and counterstained with DAPI (blue). (D) Higher magnification of boxed areas marked in panel B, focusing on the hair follicles. White solid lines delimit follicles with TUNEL+ cells. Arrows point to apoptotic cells in hair follicles. Scale bars in B: 50 μm, in C: 25 μm. (E) Quantitation of percentage of apoptotic TUNEL+ cells per field in skin of the indicated Sos genotypes. Data are expressed as means ± the SD. n = 3/genotype. ** p < 0.01 vs. WT, *** p < 0.001 vs. WT. (F) Representative flow cytometry scatter plots showing the different epidermal populations according to CD34 and integrin α6 expression in the skin of WT and Sos2 KO neonate mice. The gate used for the isolation of basal bulge epidermal stem cell population is depicted with a square. (G) The graph illustrates the quantitation of the abundance of the CD34+/integrin α6+ pools in the skin of WT and Sos2 KO neonatal mice. ** p < 0.01; n = 4/genotype.

