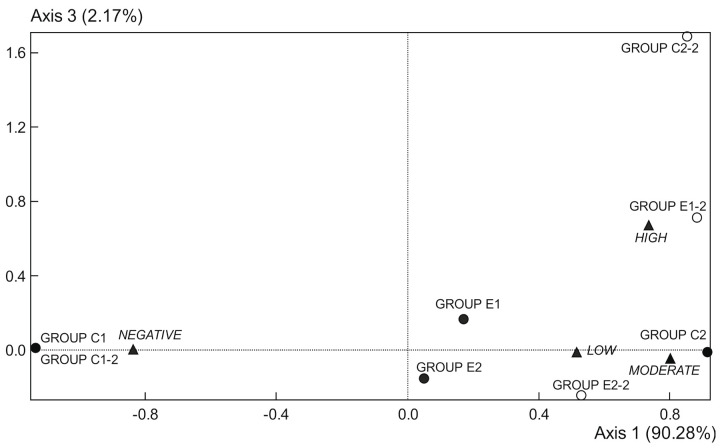
Figure 2.
Correspondence analysis scores; plot of occult fecal blood data from 1st week (●) and 9th week (○). Data points represent replicates of the experimental groups (C1, C2, E1, and E2), and intensities of staining (▲) (from absence to very intense). C1 wild strain fed a control diet, C2 ApcMin/+ fed a control diet, E1 ApcMin/+ fed a diet supplemented with microencapsulated Bf and Lg, E2 ApcMin/+ fed a diet supplemented with microencapsulated Bf, Lg, and quercetin.

