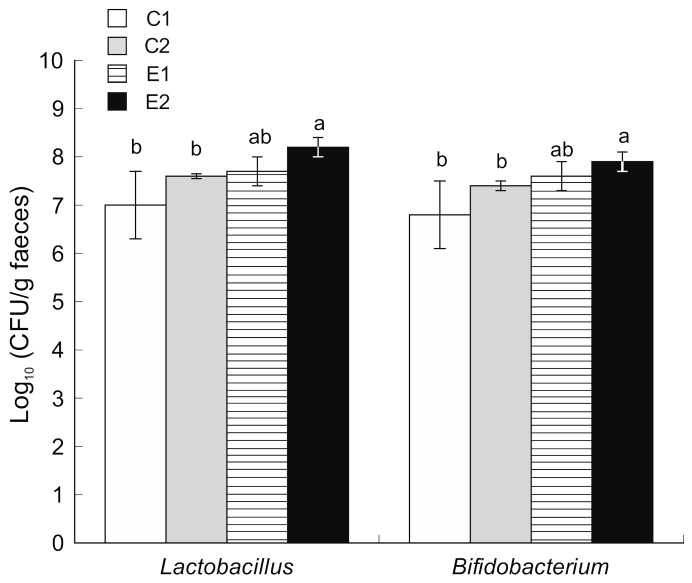
Figure 4.
Microbial counts of Lactobacillus and Bifidobacterium in caecum faecal samples obtained after sacrifice (mean and SD, n = 12). C1 wild-type mice fed a standard diet, C2 ApcMin/+ fed a standard diet, E1 ApcMin/+ fed a standard diet supplemented with microencapsulated Bf and Lg, E2 ApcMin/+ fed a standard diet supplemented with microencapsulated Bf, Lg and quercetin. Bars with different letters indicate statistically significant differences (p < 0.05; one-way ANOVA was used followed by Tukey’s post hoc test).

