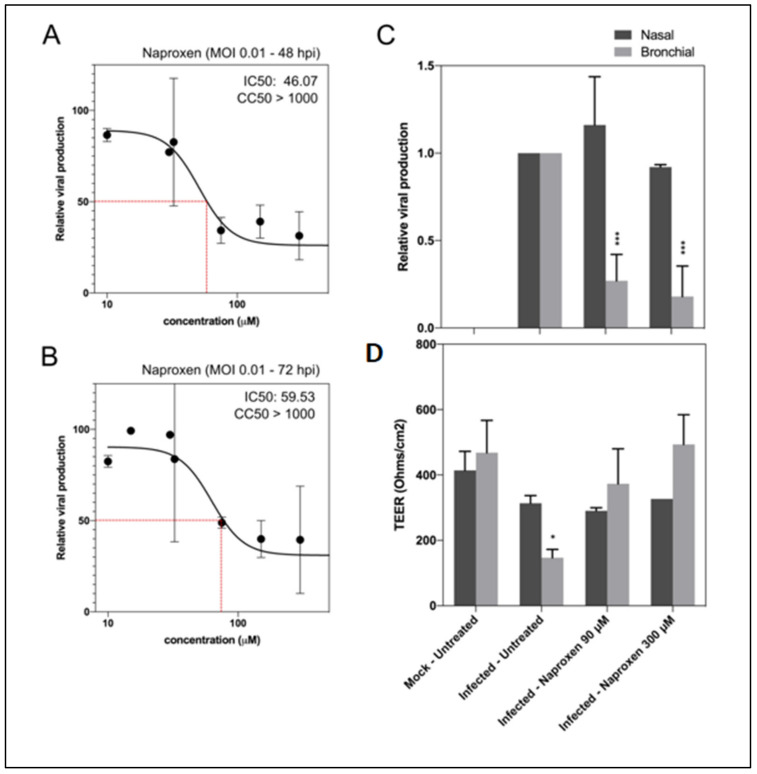
Figure 6.
Naproxen inhibits SARS-CoV-2 infection in Vero E6 cells and in HAE. (A,B) Dose–response curves of naproxen at 48 and 72 hpi in infected Vero E6 cells. Cells were infected at MOI 0.01 with SARS-CoV-2 and then treated 1 h postinfection with a large range of concentration of naproxen; (C) Relative intracellular viral genome quantification and (D) trans-epithelial resistance (TEER in Ohms/cm2) between the apical and basal poles in nasal and bronchial HAE at 48 hpi. Results are expressed in relative viral production compared to the infected untreated control and relative TEER compared to t = 0 (before infection). *** p < 0.001 and * p < 0.05 compared to the infected untreated (viral titers) or uninfected (TEER) groups by Student’s t-test. Data are representative of three independent experiment.

