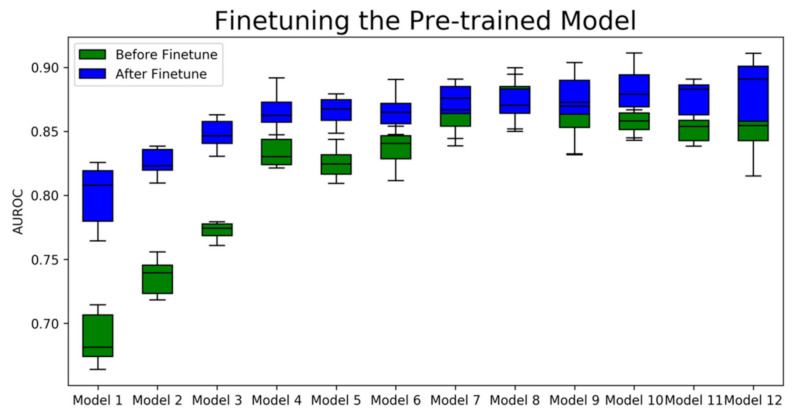
Figure 3.
The average AUROC of the pre-trained models and fine-tuned models of the test set. Model 1 to model 12 are models that possess different sets of hyperparameters listed in Table 1. The green boxes are the distributions of AUROC scores computed from the random split test sets before finetuning the pre-trained models, and the blue boxes are the distributions of AUROC scores computed from the same random split test sets after 100 epochs of finetuning.

