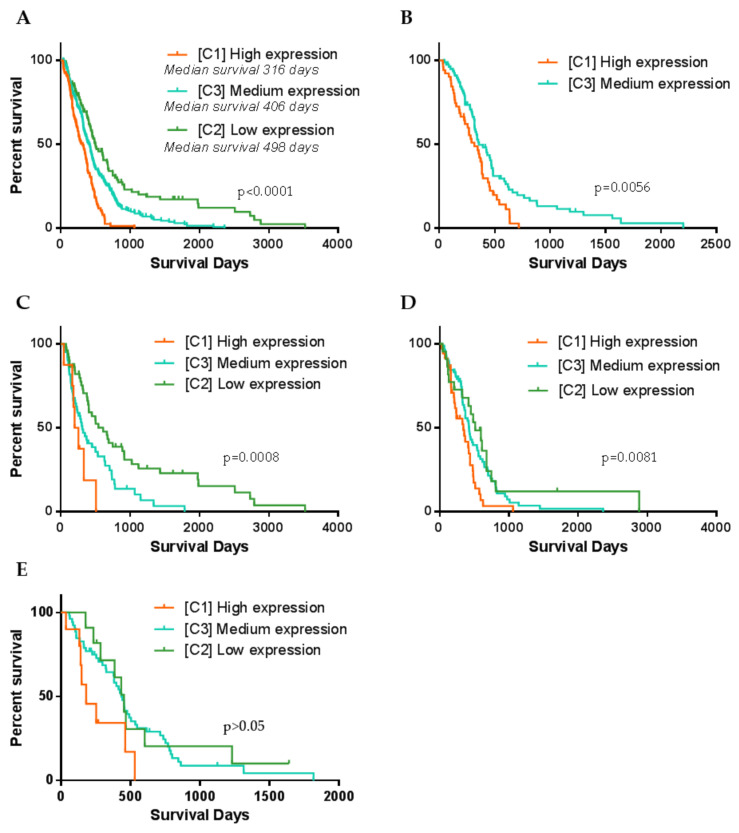
Figure 4.
Kaplan–Meier curve plots representing different GBM patients’ groups survival. (A) Patient survival curves when specimens were divided according to the cluster dependence. (B) Only Mesenchymal GBM subtype patient survival curves calculated according to the cluster dependence. (C–E) Accordingly, Proneural, Classsical and Neural GBM subtype patient survival curves calculated according to the cluster dependence. p-value given based on Log-Rank (Mantel–Cox) test.

