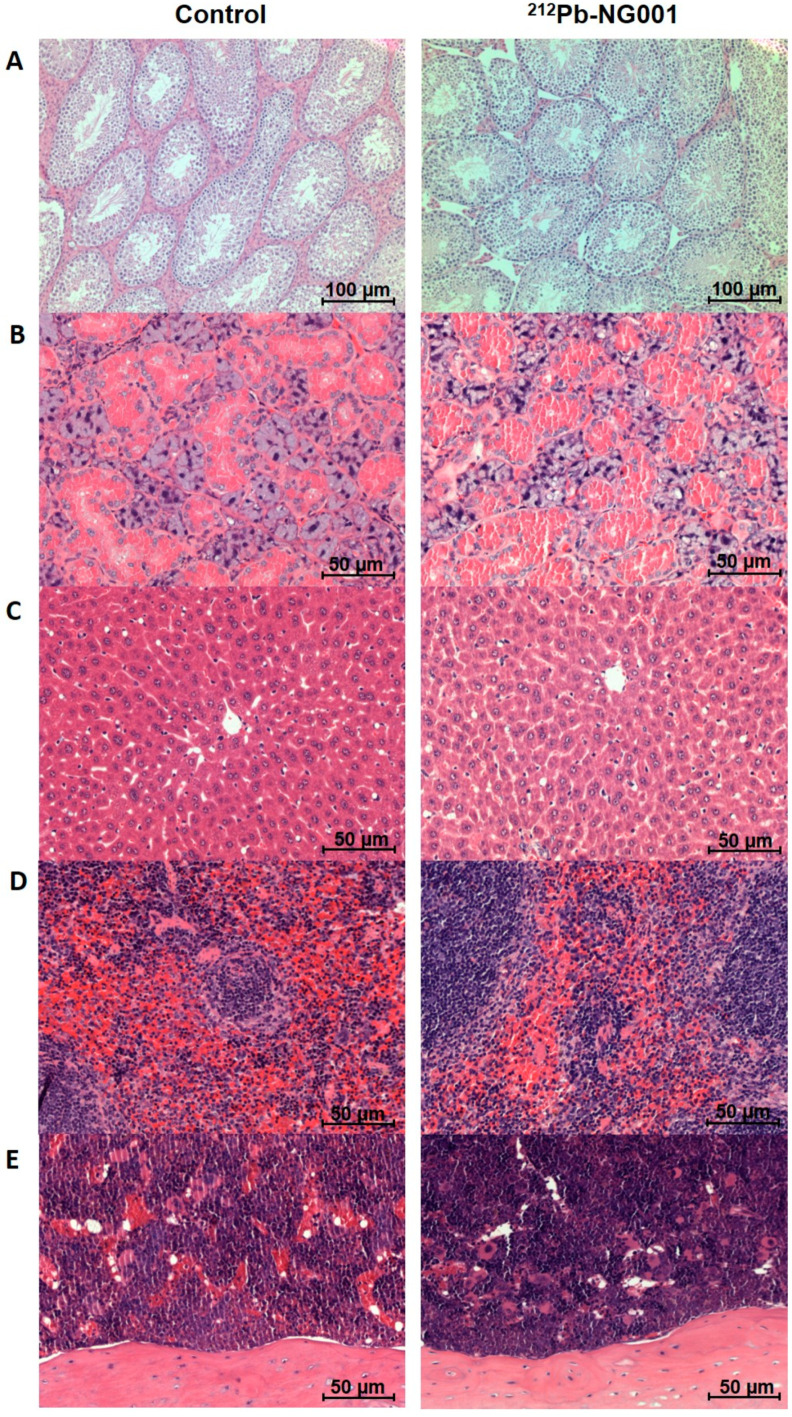
Figure 6.
Representative histological images of testes (×10 magnification, (A)), salivary glands (×20 magnification, (B)), liver (×20 magnification, (C)), spleen (×20 magnification, (D)) and femur (×20 magnification, (E)) of BALB/c mice 12 months after administration of saline (left) or 0.33 MBq of 212Pb-NG001 (right).

