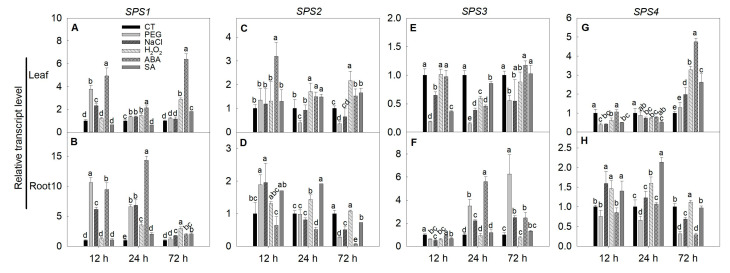
Figure 8.
Changes in the expression of SPS family genes under different exogenous stimuli conditions. The three-leaf age seedlings were treated with 20% (w/w) polyethylene glycerol-6000 (PEG-6000), 150 mM NaCl, 1.5 mM H2O2, 50 μM abscisic acid (ABA) or 200 μM salicylic acid (SA) for 12 to 72 h, after which the leaves and roots were collected for gene expression analysis using quantitative RT-PCR. (A) SPS1 expression in leaves; (B) SPS1 expression in roots; (C) SPS2 expression in leaves; (D) SPS2 expression in roots; (E) SPS3 expression in leaves; (F) SPS3 expression in roots; (G) SPS4 expression in leaves; (H) SPS4 expression in roots. Actin, TIP41 and 17sRNA were used as internal controls. Data are means ± SD (n = 3). Different letters above bars indicate a significant difference at p < 0.05. CT, control.

