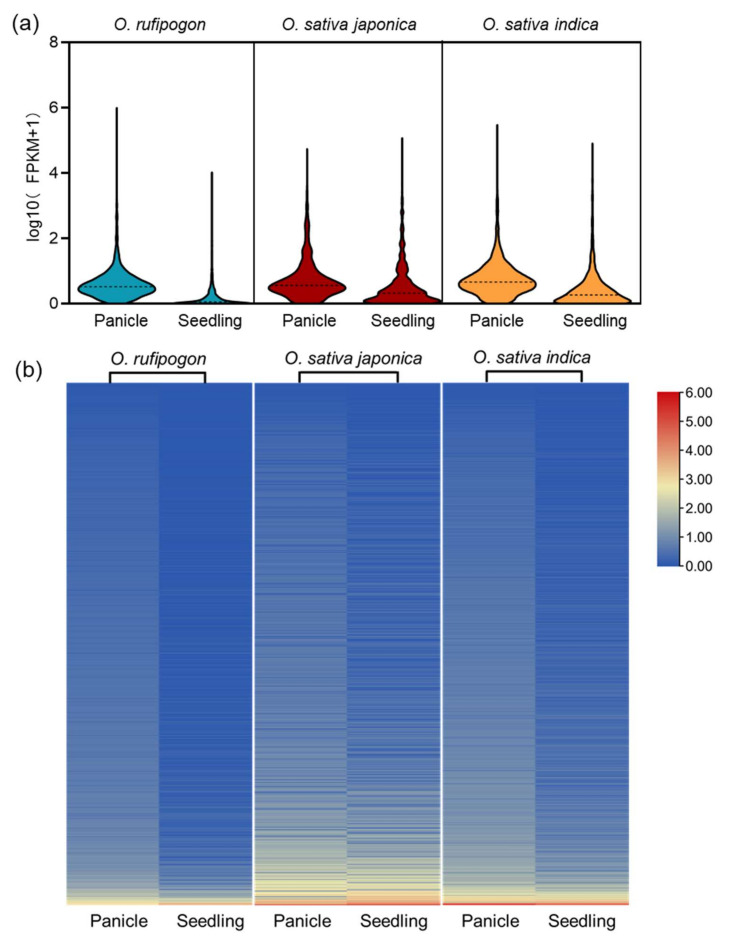
Figure 3.
Expression analysis of lncRNAs from wild and cultivated rice. (a) The FPKM distribution of lncRNAs in panicle and seedling of wild and cultivated rice. (b) Heatmap of differentially expressed lncRNAs in panicle and seedling of wild and cultivated rice. All expression levels are normalized and displayed as log10(FPKM+1). The color from blue to red represents lowest to highest lncRNA expression.

