Figure 4.
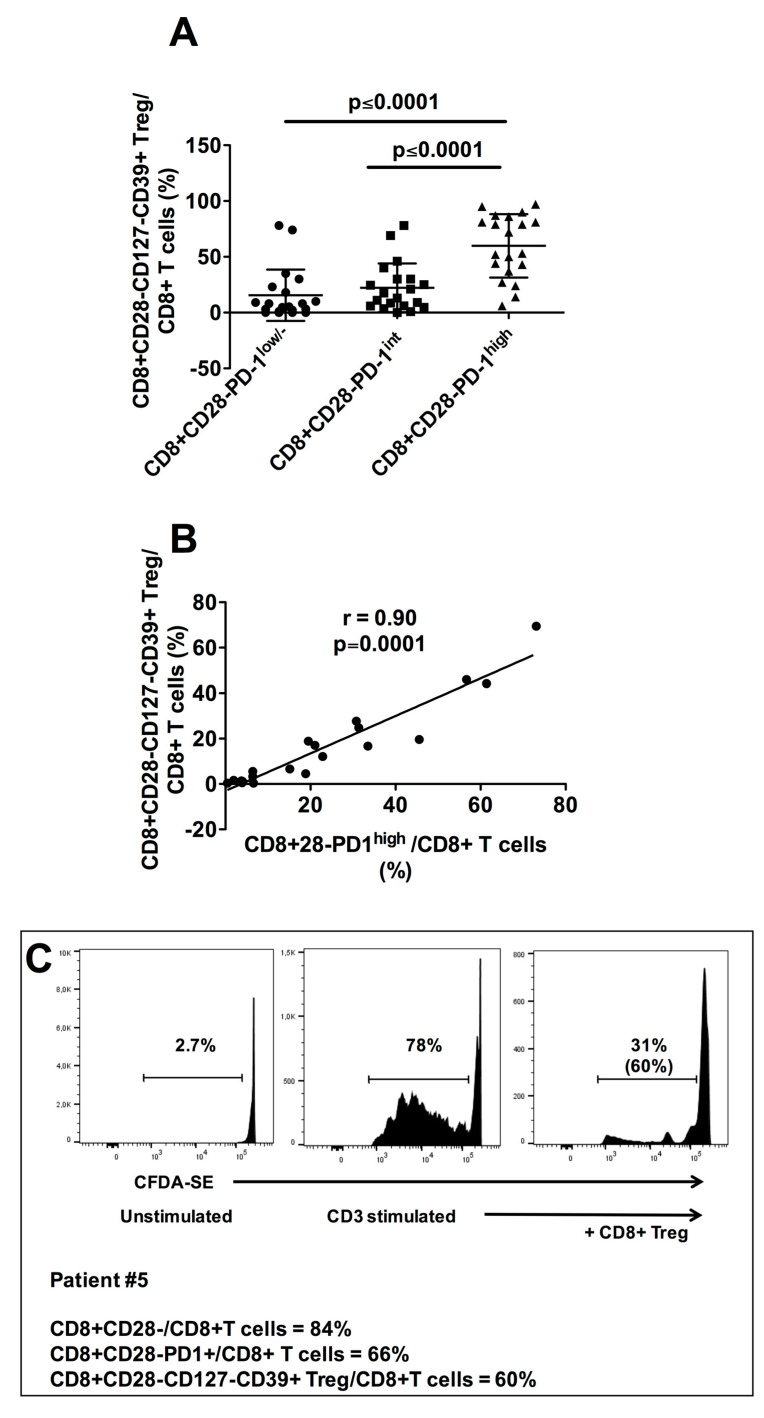
Relationship between tumor infiltrating CD8+CD28−PD1hi T cells and CD8+CD28−CD127−CD39+ Treg in HNSCC patients. (A): Mean frequencies of CD8+CD28−CD127−CD39+ Treg among CD8+CD28−PD-1lo, CD8+CD28−PD-1int and CD8+CD28−PD-1hi T cell subpopulations. Statistical significant differences are evidenced. (B): Statistical correlation between the frequency of tumor infiltrating CD8+CD28−PD-1hi T cells and that of tumor infiltrating CD8+CD28−CD127−CD39+ Treg in our cohort of HNSCC patients. (C): Proliferation suppression assay performed with the CD8+ T cell infiltrate from the representative patient #5 containing comparable frequencies of CD8+CD28−PD-1hi (66%) and CD8+CD28−CD127−CD39+ Treg (60%). The percentages of T cell proliferation under unstimulated conditions (left panel) or anti-CD3 UCHT1 mAb–stimulated conditions in absence (middle panel) or presence (right panel) of tumor infiltrating CD8+CD28−CD127−CD39+ Treg (CD8+ Treg in the Figure) are shown; the percentage of proliferation inhibition by CD8+CD28−CD127−CD39+Treg is shown in parentheses in the right panel. One out of two concordant experiments performed with cells of different patients.

