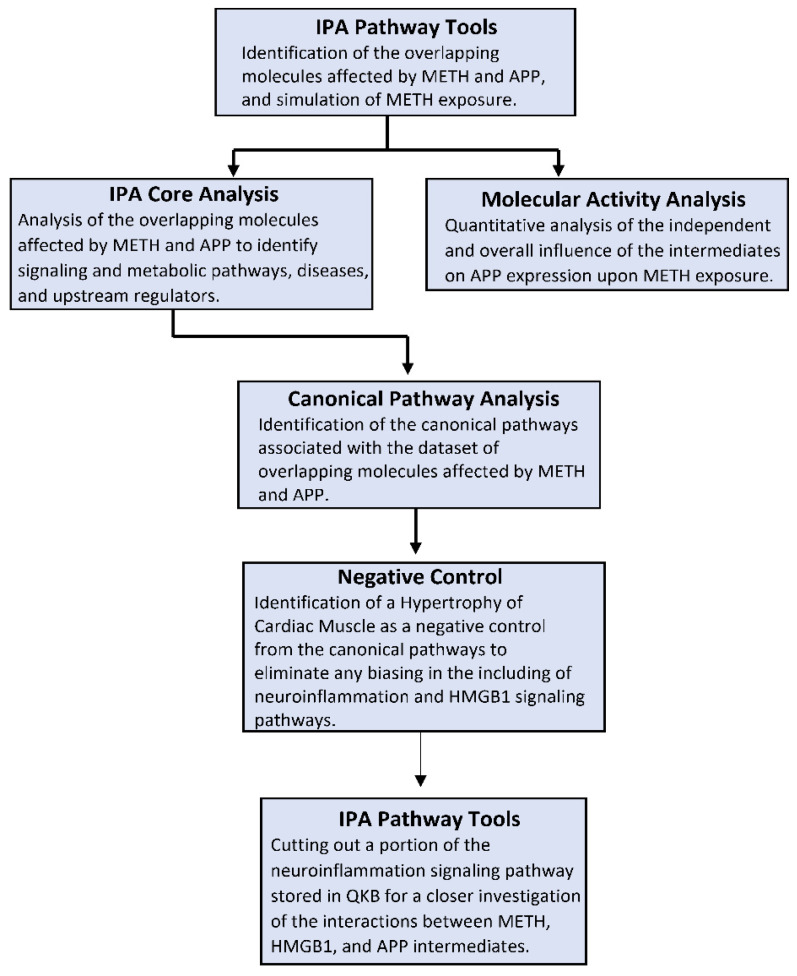
Figure 1.
Methods Flowchart. The steps involved in utilizing the resources offered by IPA are outlined in the flowchart. The first step was to use the basic IPA pathway tools, including but not limited to “Grow”, “Trim”, “Connect”, “Pathway Finder”, and “MAP”. The molecular activity analysis was conducted after the generation of every pathway using mathematical algorithms and data stored in QKB. A core analysis was run on the dataset of molecules from every generated pathway; the resulting canonical pathways were analyzed to identify the role of the molecules within the canonical pathways. IPA tools were again used to excise a portion of the neuroinflammation signaling pathway stored in QKB for a closer and more detailed look of the implicated molecules.

