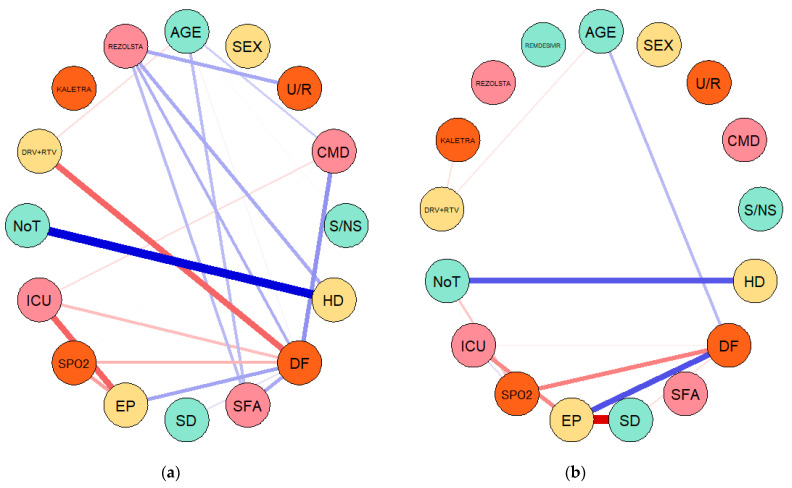
Figure 3.
GGMs configuration through the EBIC with graphical lasso method and the associated results: (a) first sample of 145 COVID-19 patients from the first wave of infection; (b) second sample of 129 COVID-19 patients from the second wave of infection. Source: Own configuration in RStudio version 3.6.3.

