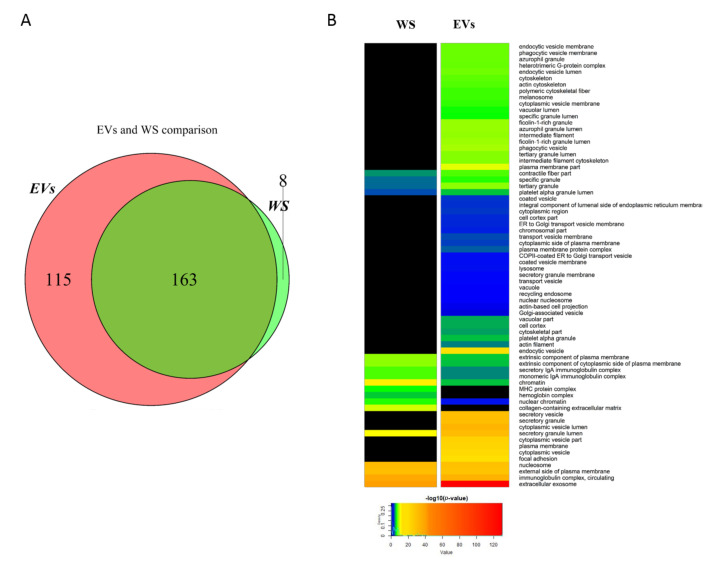
Figure 1.
Qualitative comparison between whole saliva (WS) and extracellular vesicles (EVs) proteomics profiles. Venn diagram shows the differences in the number of identified proteins among the two groups of samples (A). GO cellular component (CC) analysis evidenced a significant enrichment of extracellular vesicles processes in EVs fraction compared to WS. Color-coded scale is associated to the significance of association of proteins to a specific GO term. The higher is the significance of association, the more the colors are shifted to red inks (B).

