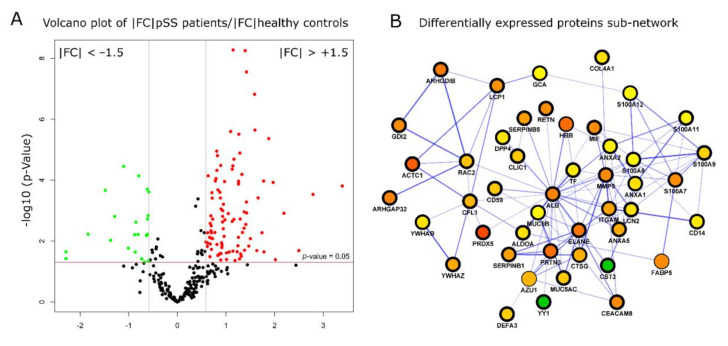
Figure 3.
Differential expression analysis of EVs Sjogren’s data in healthy controls and patients. Volcano plot shows the significantly up- (red) and down- (green) regulated proteins with a fold change of FC = 1.5 and p < 0.05 (A). The most representative protein subnetwork was extracted from a comprehensive protein interaction network of differentially expressed proteins according to the number of nodes (proteins) and edges (links) within the subnetwork. Node colors indicate the fold change expressed as protein abundance ratio between Sjogren’s patients and controls groups (min |FC|=0.6714, green, max |FC| =10.4881, purple (B).

