Figure 4.
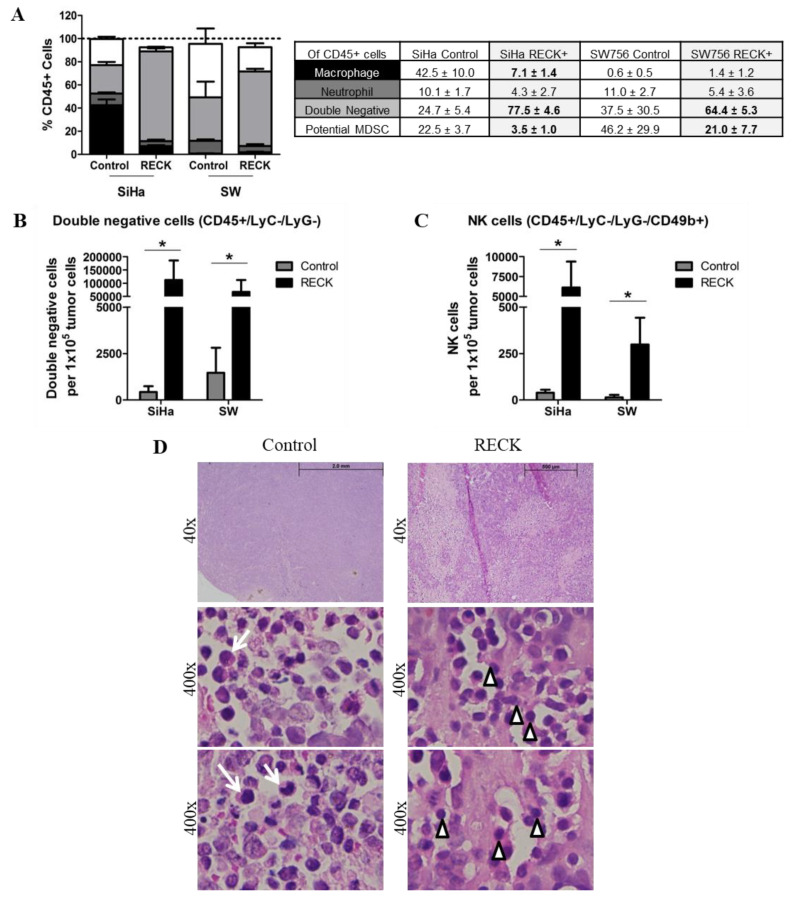
RECK over expression is associated with increased proportion of specific inflammatory infiltrate cell populations. (A). Intra-tumoral populations were characterized by immunostaining with CD45, Ly6C, Ly6G, F4/80 and CD49b antibodies, followed by flow cytometry. Tumor fractions of at least three animals from each group were used for the analysis and at least 1 × 10⁵ cells/events were acquired. Significant differences in population proportion are indicated in bold font in the table. (B,C). Proportion of Double negative (B) and NK cells (C) relative to 100,000 tumor cells. (D). Representation of hematoxylin/eosin tumor sections used for morphology evaluation of the inflammatory infiltrate in SW756 RECK+ tumors. White arrows identify cells with monocyte and macrophage morphology and white arrow heads indicate lymphoid phenotype cells. * p < 0.05 by Kruskal–Wallis (4A) or Mann–Whitney (4B and 4C) test.

